12/27/2025 Youtube video summaries using Grok AI, Google Gemini, and Microsoft Copilot
China's Economic Challenges: A Summary of Alleged Crisis Narratives (Approximately 2,500 words – 10-minute read)
The provided text appears to be a transcript from an anti-CCP propaganda video or report, likely produced by outlets like The Epoch Times (associated with Falun Gong), which are known for highly critical and often exaggerated portrayals of China's economy and government. It paints a picture of catastrophic collapse: widespread poverty affecting over 900 million people, a crumbling real estate sector with abandoned projects and desperate buyers, skyrocketing unemployment, debt defaults, worker strikes, and systemic failure rooted in CCP governance. Personal anecdotes depict humiliation from debt, starvation-level survival, and lost dignity, while blaming state monopolies, zero-COVID policies, and propaganda for the woes.
Key claims include:
- Poverty and Inequality: Over 900–964 million people (70% of the population) earning under 2,000 yuan (~$280) monthly, citing deleted reports and experts like those from Beijing Normal University or Tsinghua.
- Real Estate Crisis: Developers fleeing, unfinished towers, pensioners losing savings, mass protests.
- Unemployment and Desperation: Astronomical joblessness, youth "lying flat," civil servant pay cuts, men fishing to hide unemployment, strikes (e.g., at BYD), arson over unpaid wages.
- Debt and Financial Strain: Frozen credit cards, slashed limits, harassment by collectors, rising defaults, shift to "shameless" non-repayment.
- Broader Issues: Dysfunctional street economy, education refund demands, low household income-to-GDP ratio, wealth concentrated in the top 1%, vampire-like state extraction.
- Root Causes: CCP's monopoly on resources, failed stimulus, propaganda hiding reality.
While the text evokes severe hardship and echoes real structural problems in China's economy as of late 2025, many specifics are overstated or outdated for dramatic effect.
Real Context from Reliable Sources (Late 2025)
China's economy faced significant headwinds in 2025: a prolonged real estate downturn (ongoing since 2020–2021), weak domestic consumption, deflationary pressures, high youth unemployment, and local government debt strains. Growth slowed markedly, with exports providing the main support amid U.S. trade tensions.
- GDP Growth: Official figures claimed around 5% for 2025, but independent estimates (e.g., Rhodium Group) suggested only 2.5–3%, driven by collapsing investment. The World Bank and IMF projected 4.5–4.9%. Deflation persisted for multiple quarters, and fixed-asset investment (including property) declined sharply—potentially the first annual drop in decades.
- Real Estate: The sector remained in crisis, with developers like China Vanke narrowly avoiding defaults and Evergrande fully liquidated and delisted. Property investment fell 15–20%, prices dropped, and unsold inventory piled up, eroding household wealth and confidence. No comprehensive bailout occurred, prolonging the drag.
- Unemployment: Overall urban surveyed rate hovered at 5.1–5.3%. Youth (16–24, excluding students) peaked at 18.9% mid-year but eased to ~16.9% by November—high but not "astronomical" extremes. Structural mismatches (graduates vs. available jobs) and gig economy growth contributed, with some "lying flat" as protest.
- Poverty: China officially eradicated extreme poverty (under ~$2/day) years ago. At higher lines (e.g., $5.50/day for middle-income), 13–17% remained vulnerable. No credible 2025 data supports 900+ million in extreme poverty; pre-2020 figures (e.g., 600 million on ~1,000 yuan/month) were cited in propaganda but improved post-COVID. Rural incomes rose, though urban-rural gaps persist.
- Debt and Consumption: Household debt rose (mortgages, credit), with some limit cuts and collection issues. Defaults increased in property-related areas, but no nationwide "chain reaction" bankruptcy wave. Consumption was weak (retail sales slowed), partly from property wealth effects and caution.
- Stimulus and Policy: Beijing rolled out measures—rate cuts, trade-in subsidies, local debt swaps (10+ trillion yuan), bond issuance—but avoided massive debt-fueled packages. Focus shifted to high-tech manufacturing, exports, and targeted support (e.g., elderly care, AI). Effectiveness was limited: no strong consumption rebound, persistent imbalances.
Protests and incidents (strikes, unpaid wages) occurred sporadically, often in manufacturing or construction, but not at the mass scale depicted. Social media slogans and anecdotes reflect real frustrations, amplified online amid censorship.
Why the Exaggeration?
Such narratives serve ideological goals: portraying the CCP as incompetent or malicious to undermine legitimacy. They mix truths (property slump, youth job woes, inequality) with hyperbole (bottomless depression, 1 billion starving) and unsourced claims (deleted reports often from years prior). Mainstream sources (Reuters, NYT, Bloomberg) describe a slowing, imbalanced economy needing reform—not imminent collapse.
In reality, China ended 2025 with resilience in exports/tech but unresolved issues: overcapacity, low demand, demographic pressures. 2026 outlook: modest growth (3–4.5%), potential further stimulus if trade wars escalate.
This video-style report spreads alarm but distorts scale. China's challenges are serious and structural, warranting attention, yet far from the apocalyptic "hell" described. Balanced views from diverse sources reveal a complex transition, not total failure
The Slow Unraveling of the Petrodollar: A Dramatic Narrative on Dollar Decline (Approximately 2,400 words – 10-minute read)
The provided text is a scripted monologue from a sensationalist video (likely from alternative financial channels emphasizing doom-and-gloom geopolitics). It argues that the US dollar's dominance as the world's reserve currency—rooted in the 1970s "petrodollar" deal with Saudi Arabia—is collapsing rapidly. This will trigger hyperinflation, economic ruin for the US middle class, and a shift to a multipolar world favoring BRICS nations, gold, and alternative systems.
Core Narrative Points
- Historical Setup: Empires fall via currency debasement, not invasion. The 1971 Nixon shock ended the gold standard, leading to 1973 oil embargo chaos. US Treasury Secretary William Simon secretly negotiated with Saudi Arabia in 1974: US military protection and arms in exchange for OPEC pricing oil exclusively in dollars, with petrodollars recycled into US Treasuries (hidden "add-on" bidding).
- Mechanics of Dominance: This created artificial dollar demand—nations must acquire dollars for oil, exporting real goods for printed paper. It enabled US deficits, cheap imports, but hollowed out manufacturing (Triffin dilemma).
- Enforcement Through Force: Examples include Iraq (Saddam switched to euros in 2000; invaded 2003, switched back) and Libya (Gaddafi's gold-backed dinar plan; NATO intervention 2011).
- Turning Point: 2022 Russia sanctions "weaponized" the dollar (SWIFT exclusion, reserve freezes), eroding neutrality and trust. Russia pivoted to rubles/yuan, shadow fleets; ruble recovered strongly.
- Emerging Alternatives: China's yuan oil futures (Shanghai INE) with gold convertibility; Saudi openness to non-dollar trade (2023 statements); BRICS expansion; mBridge CBDC for peer-to-peer settlements bypassing SWIFT/US oversight.
- US Self-Inflicted Wounds: $35+ trillion debt; interest payments now exceed defense spending; returning "Eurodollars" could cause asset hyperinflation.
- Endgame: Billionaires hoard gold/land; shift to hard assets; slow-then-sudden currency death.
The tone is apocalyptic: the petrodollar is "dead," ushering in structural inflation, third-worldification of America, and victory for commodity powers over financialized ones.
Factual Assessment as of Late 2025
This narrative blends historical truths with exaggeration, selective facts, and speculation. The petrodollar system provided the US "exorbitant privilege" for decades, but its "death" is overstated—no sudden collapse has occurred.
- Petrodollar Status — Oil remains overwhelmingly priced and settled in USD. Saudi Arabia continues exclusive dollar sales in practice, despite 2023 signals of openness. No formal "50-year pact" expired; rumors debunked repeatedly. OPEC+ dynamics and market inertia favor dollars.
- De-Dollarization Progress — Gradual, not revolutionary. USD share in global reserves: ~57-58% (down from 72% peak but stable recently). In trade/FX: 88-90%. BRICS talks (common currency, BRICS Pay) yielded no concrete unified system by 2025 summits. Bilateral local-currency trade grew (e.g., Russia-China >90% non-dollar), but no bloc-wide replacement.
- Yuan Oil Futures (Petroyuan) — Shanghai INE grown significantly, but captures ~10-15% global volume—distant challenger to Brent/WTI.
- mBridge CBDC — Reached MVP in 2024; BIS handed over to participating central banks amid sanctions concerns. Operational but limited scale; not yet transformative.
- Russia Sanctions Impact — Accelerated bilateral de-dollarization (e.g., Russia-India rupee trade) and gold buying, but failed to cripple Russia. Boosted alternatives, eroded some trust, yet dollar remained safe-haven (strengthened initially post-2022).
- US Debt/Interest — Net interest ~$970 billion in FY2025, exceeding defense (~$917 billion)—valid concern. Debt >$38 trillion; spiral risk real, but funded sustainably so far via dollar demand.
- Gold Rush — Central banks bought record ~1,000+ tonnes annually 2022-2024; continued strong in 2025 (hundreds of tonnes). Diversification hedge, not panic flight from dollars.
Why the Alarmism?
Narratives like this appeal to gold bugs, anti-establishment views, and geopolitical skeptics. They highlight real trends—multipolarity, sanctions backlash, US fiscal strains—but predict imminent doom without evidence. Dollar dominance erodes slowly (decades-long trend), bolstered by deep markets, rule of law, and no viable full alternative. Challenges (rising rates, deficits, rivals) exist, but no "mathematical reset" looms in years.
In summary, the petrodollar evolves amid shifts, but remains alive. The video dramatizes valid long-term risks into a near-term catastrophe script. Balanced outlook: gradual multipolarity ahead, with dollar still king—for now. Investors might consider diversification (gold, commodities), but hyperinflation/tsunami scenarios remain speculative.
Persistent Tensions and Cautious Thaw: India-China Border Dynamics in Late 2025 (Approximately 2,400 words – 10-minute read)
The provided text compiles social media speculation, historical context, and recent developments into a narrative highlighting ongoing India-China frictions, centered on a viral video and broader military/economic strains. It portrays deep mistrust, with India accelerating Himalayan infrastructure to counter China post-2020 clashes, while accusing Beijing of propaganda and concealment.
The Viral Robot Video
In early December 2025, unverified videos circulated on platforms like X and Instagram, showing a white, humanoid-like figure standing motionless in a desolate high-altitude landscape, allegedly on the Chinese side of the Line of Actual Control (LAC). Filmed from the Indian side (with Hindi dialogue and laughter audible), it sparked claims of a Chinese "spy robot" or surveillance sentinel patrolling the border.
Chinese patriotic accounts reportedly reposted it, fueling theories of state propaganda to showcase technological prowess. Some netizens mocked its practicality: stationary targets vulnerable to attack, limited battery life (1-2 hours in mountains), and ineffectiveness compared to human patrols. Others linked it to China's real humanoid robot trials (e.g., UBTech Walker S2 deployed on the China-Vietnam border starting December 2025 for inspections and crowd control).
No official confirmation from either government; mainstream sources (India Today, Economic Times) labeled it unverified, possibly misattributed or exaggerated. It symbolizes tech escalation in border monitoring, amid both nations' increasing use of drones, sensors, and unmanned systems since 2020.
India's Massive Infrastructure Push
A late-December 2025 Wall Street Journal report detailed India's multi-hundred-million-dollar investment in Himalayan roads, tunnels, airstrips, and helipads to address vulnerabilities exposed by the 2020 Galwan clash. Previously, poor logistics meant India needed days/weeks for reinforcements, while China mobilized in hours via superior networks.
Key projects:
- Border Roads Organisation (BRO) budget surged from ~$280M (2020) to $810M (2025), building thousands of miles of roads.
- Over 30 new helipads and upgraded airstrips.
- Nyoma Air Force Base (eastern Ladakh, ~13,700 ft altitude) operationalized in November 2025: world's highest fighter-capable base, ~30-40 km from LAC, with 2.7-3 km runway supporting Rafale, Su-30MKI, C-130J. Reduces deployment time to contested areas (Pangong Tso, Demchok, Depsang).
- Zojila Tunnel (~11,500 ft, $750M, ~9-14 km): year-round access to Ladakh, expected completion ~2027.
- High-altitude roads (e.g., 16,000+ ft).
Goal: Enhance mobility, logistics, deterrence—making invasion costlier. Retired Indian generals emphasize it's corrective, not aggressive.
China mirrors this: radar stations, bridges, trenches near Pangong Tso.
Historical Roots and 2020 Turning Point
The ~3,500 km LAC (disputed since 1950s) stems from Tibet's incorporation (1950), 1962 war, and unresolved boundaries. Key clashes: 2013/2017 stand-offs, 2020 Galwan (20 Indian, at least 4 Chinese deaths—China delayed acknowledgment). Hand-to-hand combat (no firearms per protocols) at 14,000+ ft highlighted risks.
Post-2020: Heavy deployments, frozen ties (banned apps, restricted investments, no direct flights until October 2025).
October 2024 agreement: Disengagement in remaining friction points (Depsang, Demchok); resumed patrols. Direct flights restarted October 26, 2025 (e.g., IndiGo Kolkata-Guangzhou).
Yet distrust lingers: Modi visited China August 2025 but skipped Beijing parade.
Recent Flashpoints
- November 2025: UK-based Indian woman from Arunachal Pradesh detained 18 hours at Shanghai airport; officials called passport "invalid" (claiming Arunachal as Chinese territory), mocked her to "apply for Chinese passport." India issued strong demarche; highlights Beijing's persistent claims.
- December 2025 US DoD report: China leveraging LAC calm to stabilize ties, curb deeper US-India alignment; lists Arunachal as "core interest" (with Taiwan, South China Sea). China rejected as distortion, wedge-driving.
Strengthening US-India Ties
Amid thaw with China, India deepens US partnership:
- October/November 2025: Renewed 10-year defense framework (signed in Malaysia).
- November 19, 2025: US approved ~$93M sales—100 Javelin anti-tank missiles (~$46M) and 216 Excalibur precision artillery shells (~$47M).
Focus: Counter regional threats, enhance interoperability. Despite trade frictions, military ties described as strongest ever.
Outlook
2025 ends with fragile stabilization: disengagement, resumed flights/dialogue, but unresolved core disputes, mutual build-ups, and incidents like the passport row underscore volatility. US views India as Indo-Pacific counterweight; China seeks to limit that. Both prioritize deterrence in harsh terrain, where miscalculation risks escalation. Tech (drones, robots) adds new layers, but human factors—distrust, nationalism—remain dominant. Balanced normalization possible if border tranquility holds, but full trust distant.
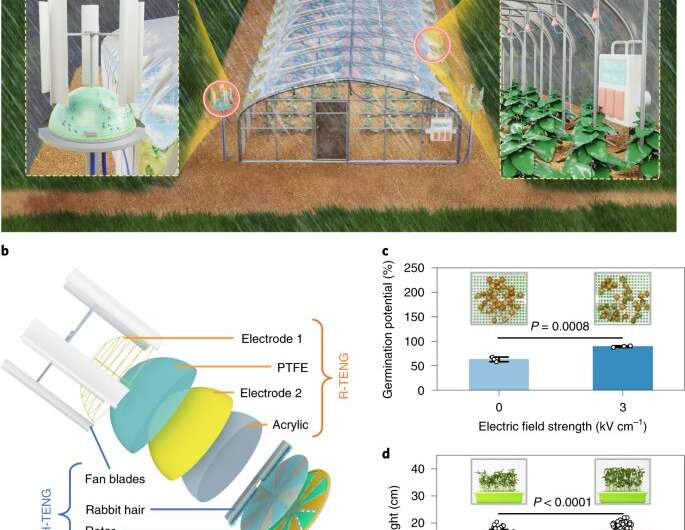
Rediscovering Electroculture: Harnessing Atmospheric Electricity for Plant Growth (Approximately 2,500 words – 10-minute read)
The provided text revives interest in electroculture—using atmospheric electricity to boost crop yields—focusing on French inventor Justin Christofleau (1865–ca. 1940s). It claims his simple copper-wire devices tripled harvests, produced giant vegetables, and were suppressed by the emerging chemical fertilizer industry. The narrative contrasts "free" natural energy with profit-driven synthetics, citing historical photos, patents, a British committee, plant electrophysiology, and modern Chinese experiments.
Historical Claims and Christofleau's Work
Christofleau, a farmer-experimenter, patented devices in the 1920s–1930s (e.g., French patents like FR764497) using copper antennas, spirals, and plates to capture "atmospheric electricity" and direct it to soil/roots. He reported yields up 200%, revived dying plants, and giant produce (e.g., massive pumpkins/cabbages). Photos from his books/pamphlets show oversized vegetables.


A British Electro-Culture Committee (1918–1936) investigated similar methods, conducting field tests but concluding in 1936 that benefits were inconsistent and not economically viable.
Scientific Basis: Atmospheric and Plant Electricity
Earth maintains a natural electric field (~100 V/m gradient: positive sky, negative ground). Plants act as "antennas," conducting faint currents that influence signals (action/variation potentials) for growth, stress response, and photosynthesis. External conductors (e.g., copper wires) could theoretically amplify this.
Passive methods (no power source) use copper spirals/coils oriented north-south.


Active methods apply voltage.
Modern Evidence: Chinese Experiments
Large-scale trials by the Chinese Academy of Agricultural Sciences (1990s–2010s) used high-voltage wires over greenhouses (3,600+ hectares). Results: 20–30% yield increases, 70–100% less pesticide, 20% less fertilizer. Mechanism: Enhanced ion transport, photosynthesis, pest repulsion.

A 2022 pea study showed ~20% more yield. Critics note methodological issues; active systems differ from passive ones.
Suppression Narrative vs. Reality
The text alleges chemical giants (post-Haber-Bosch ammonia synthesis) marginalized electroculture for recurring sales. Interest waned with reliable fertilizers; early studies were inconsistent. No direct evidence of deliberate burial—more a shift to proven methods.
Passive Electroculture Today
Social media revives simple copper spirals (cheap, safe). Anecdotes claim better growth/pest resistance, but controlled studies (e.g., 2025 PLOS One on container veggies) found no benefits—any gains likely from copper as micronutrient in deficient soils.
Practical DIY and Outlook
For passive trials: Wrap 14-gauge copper wire into 5–20 cm spiral (3+ turns), orient tip north, bury near plants. Track results rigorously.
Electroculture has roots in real phenomena (atmospheric fields, plant electrophysiology) and some active-system promise for sustainable farming. Passive copper methods lack robust evidence and remain pseudoscientific for most experts. Worth low-cost experimentation, but not a proven replacement for soil health practices. As fertilizer costs/environmental concerns rise, further research could clarify potential.
Building a Dividend Income Portfolio for Financial Freedom (Approximately 2,400 words – 10-minute read)
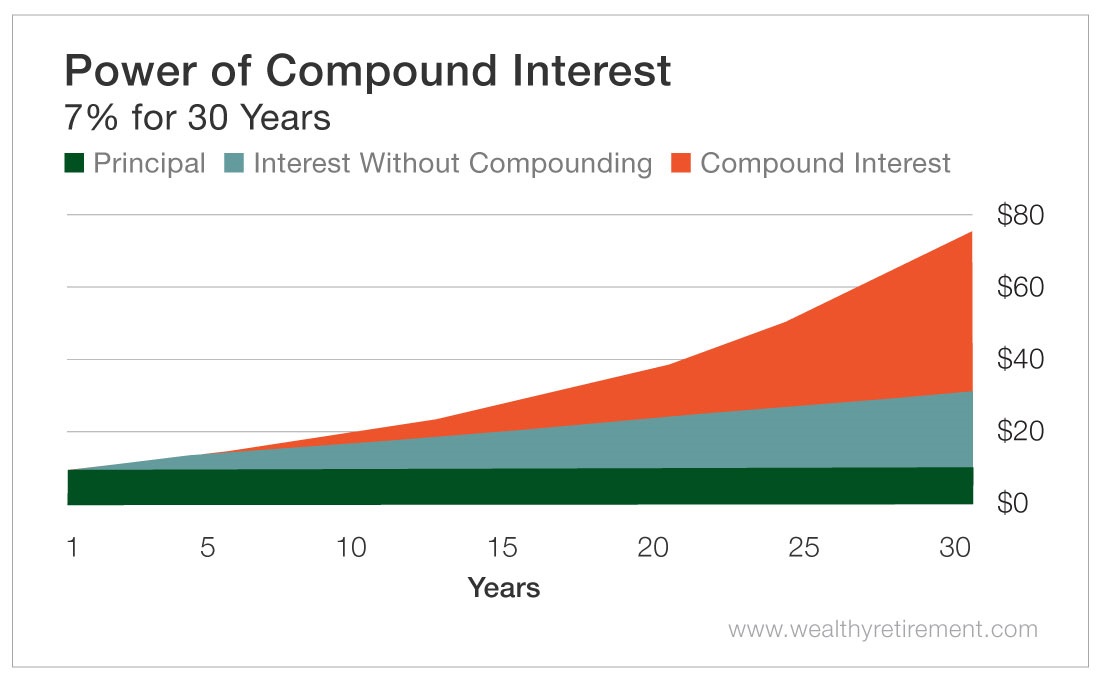
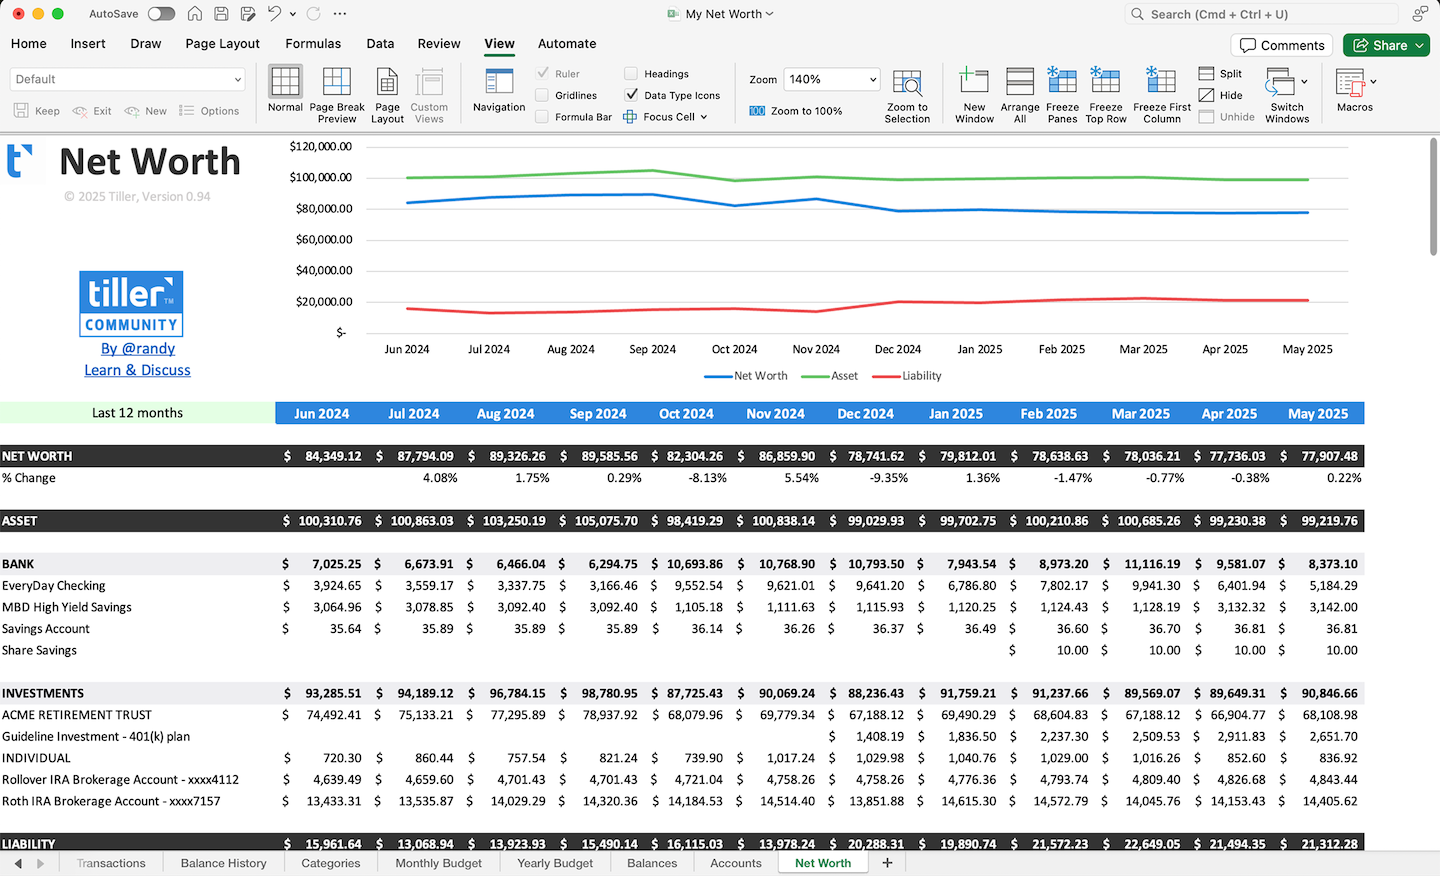
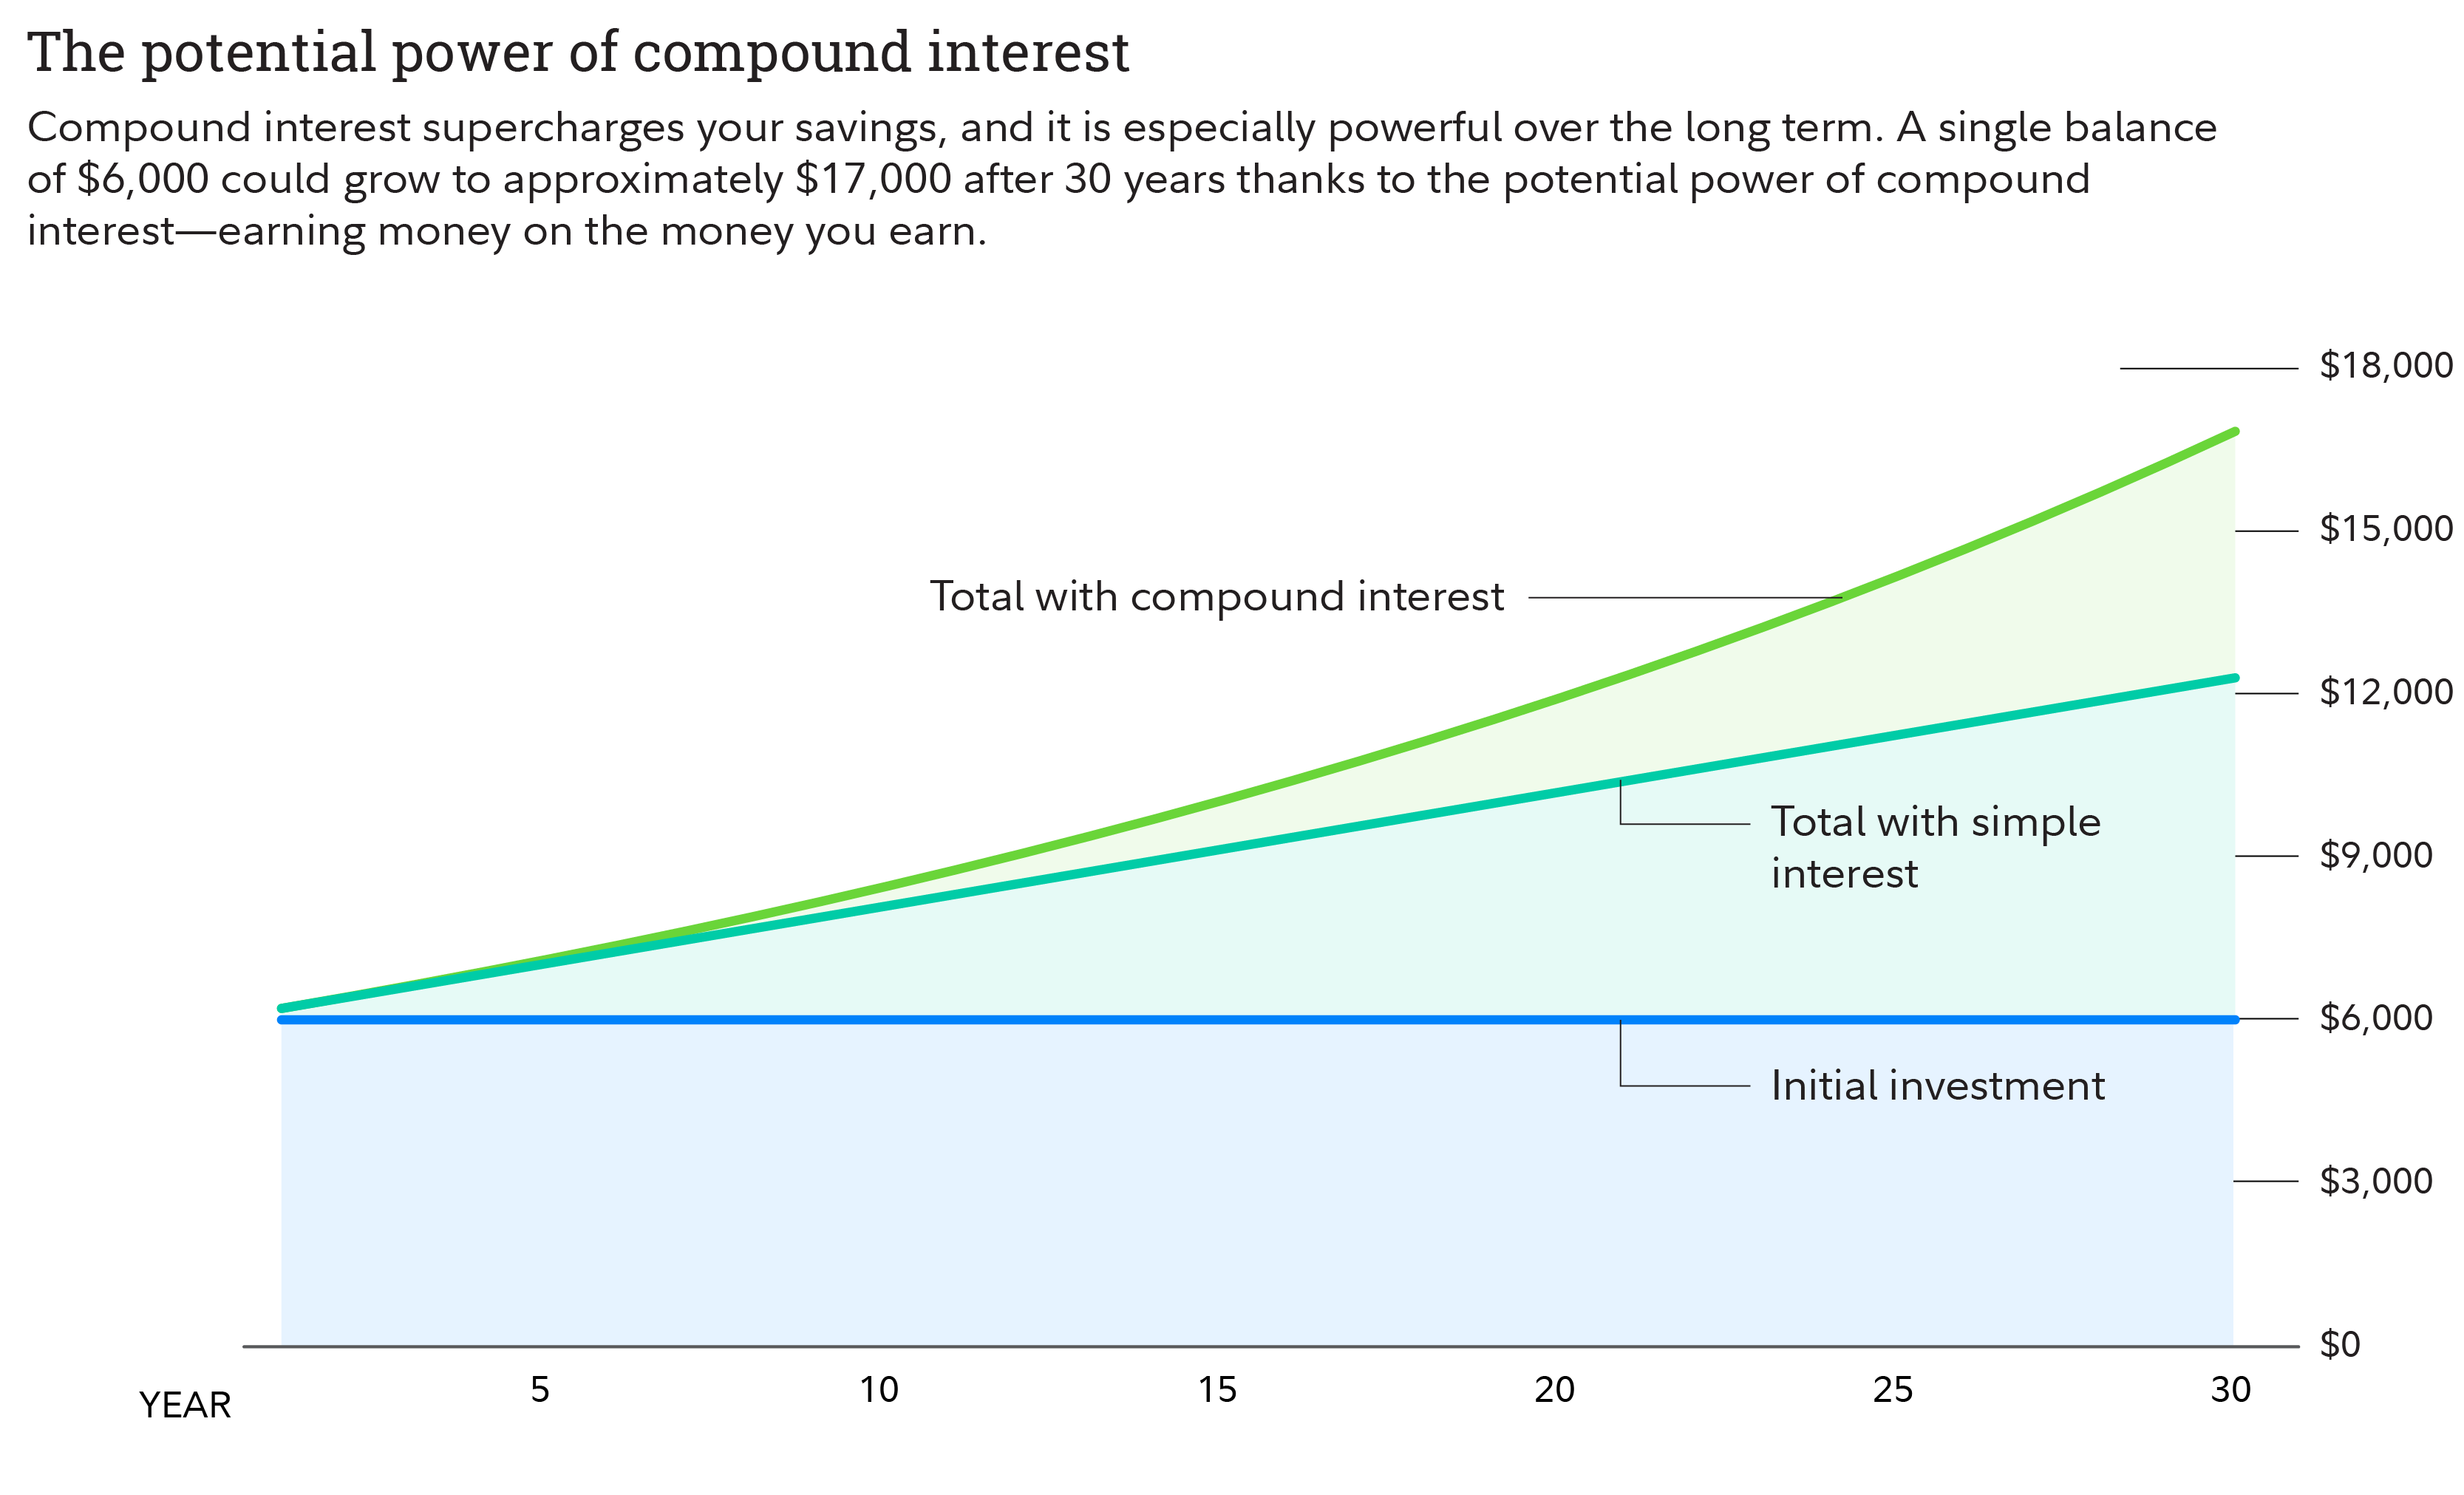
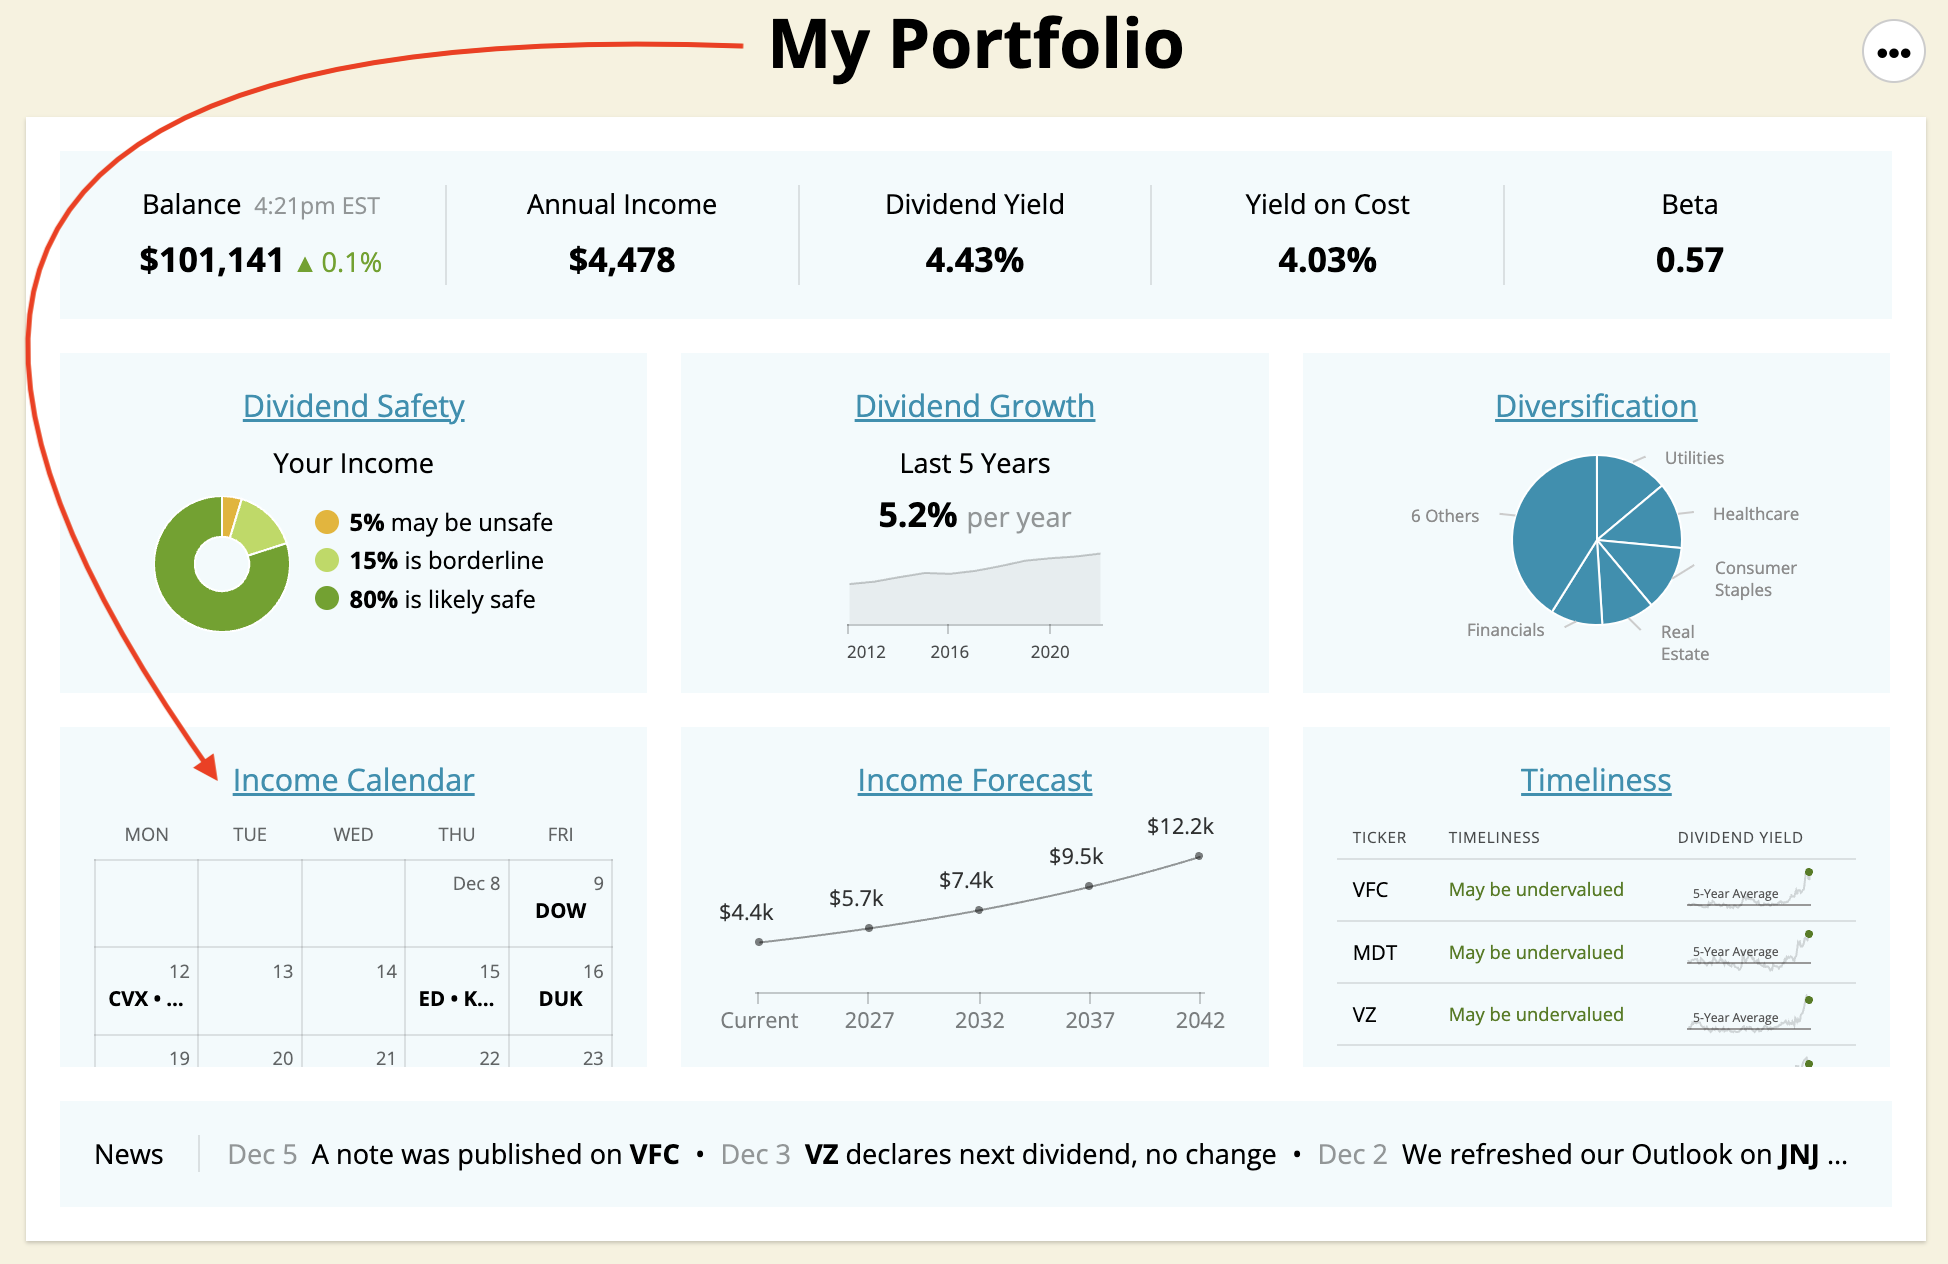
This tutorial video, presented by a Singapore-based investor with over 25 years of experience, outlines a strategy for achieving financial freedom through a diversified dividend income portfolio. The speaker claims to generate ~$46,000 annually in passive income (covering expenses) from a ~$6.8–7.7 million portfolio yielding ~6%. The approach emphasizes consistent saving, compounding, and selecting high-quality income assets.
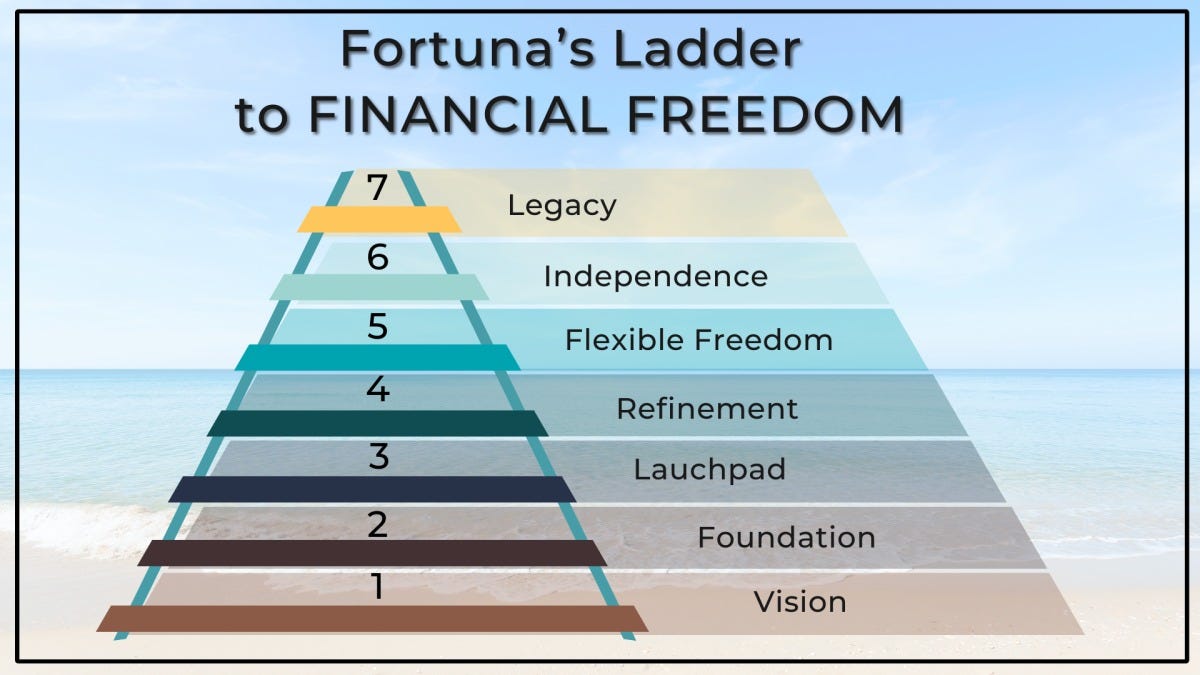

What Is Financial Freedom?
Financial freedom occurs when passive income exceeds living expenses, granting the option to stop working while maintaining your lifestyle. It's about choice—pursuing passions without financial necessity.
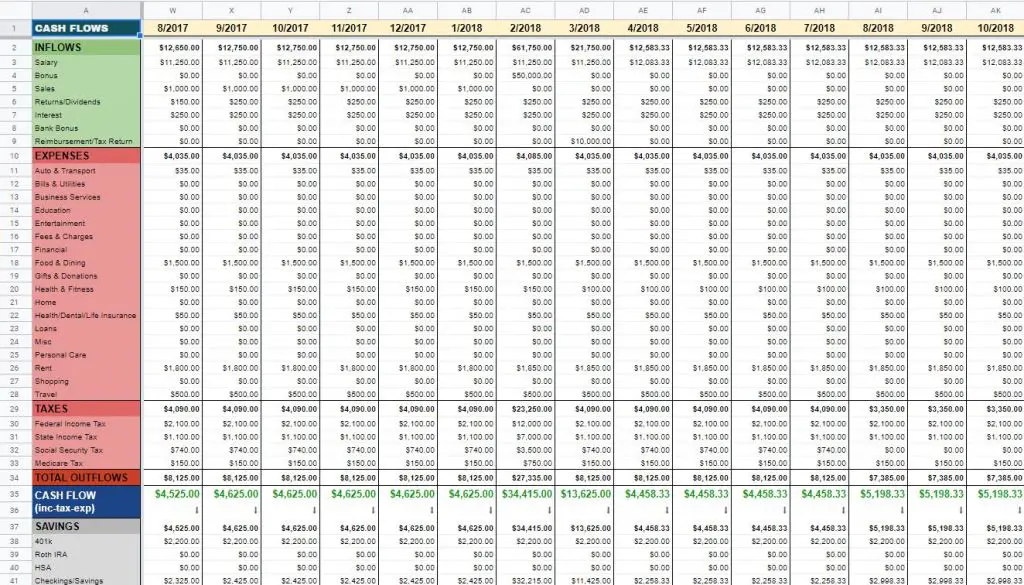
Step 1: Calculate Needs Determine monthly expenses (e.g., $3,000 → $36,000/year).
Step 2: Target Portfolio Size Divide annual needs by desired yield. The speaker targets 6% overall yield: $36,000 / 0.06 = $600,000 portfolio.
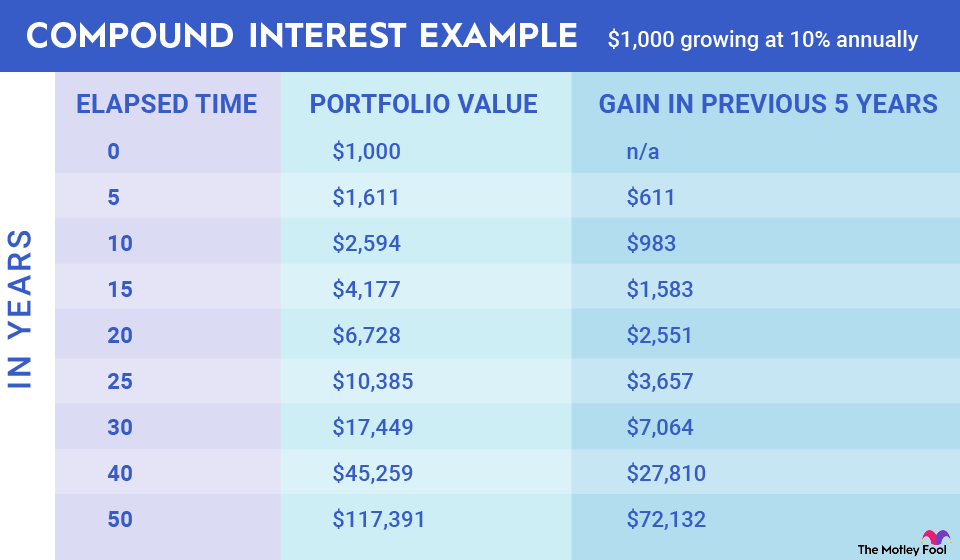
Step 3: Build Over Time Saving $1,000/month ($12,000/year) at ~10% annual return (historical S&P 500 average ~10% including dividends) reaches ~$600,000 in ~17 years (compounding calculation). Starting at age 30 → freedom by ~47; age 40 → ~57.
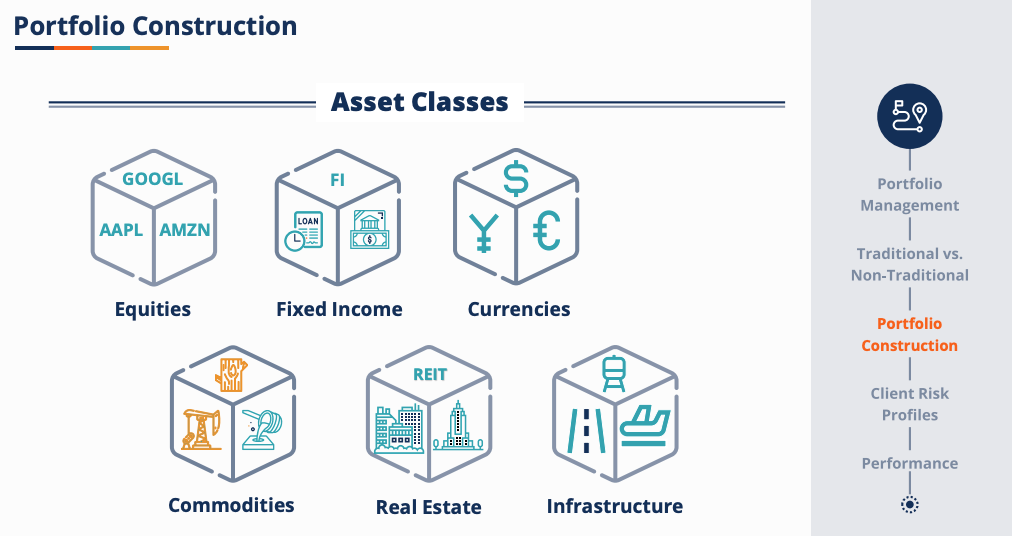
The Four Core Income Assets
The portfolio combines four assets for ~6% average yield, diversification, and resilience across economic cycles:
- High-Quality Dividend Stocks (3–6% yield) Ownership in profitable businesses sharing earnings. Favorites: Singapore banks (DBS, UOB, OCBC) yielding ~5–6% in late 2025 (e.g., DBS ~5.6–6.1% forward). Focus on consistent growers.
- REITs (Real Estate Investment Trusts) (5–7% yield) Passive property ownership without management hassles. Singapore REITs averaged ~5.5–6% in 2025.

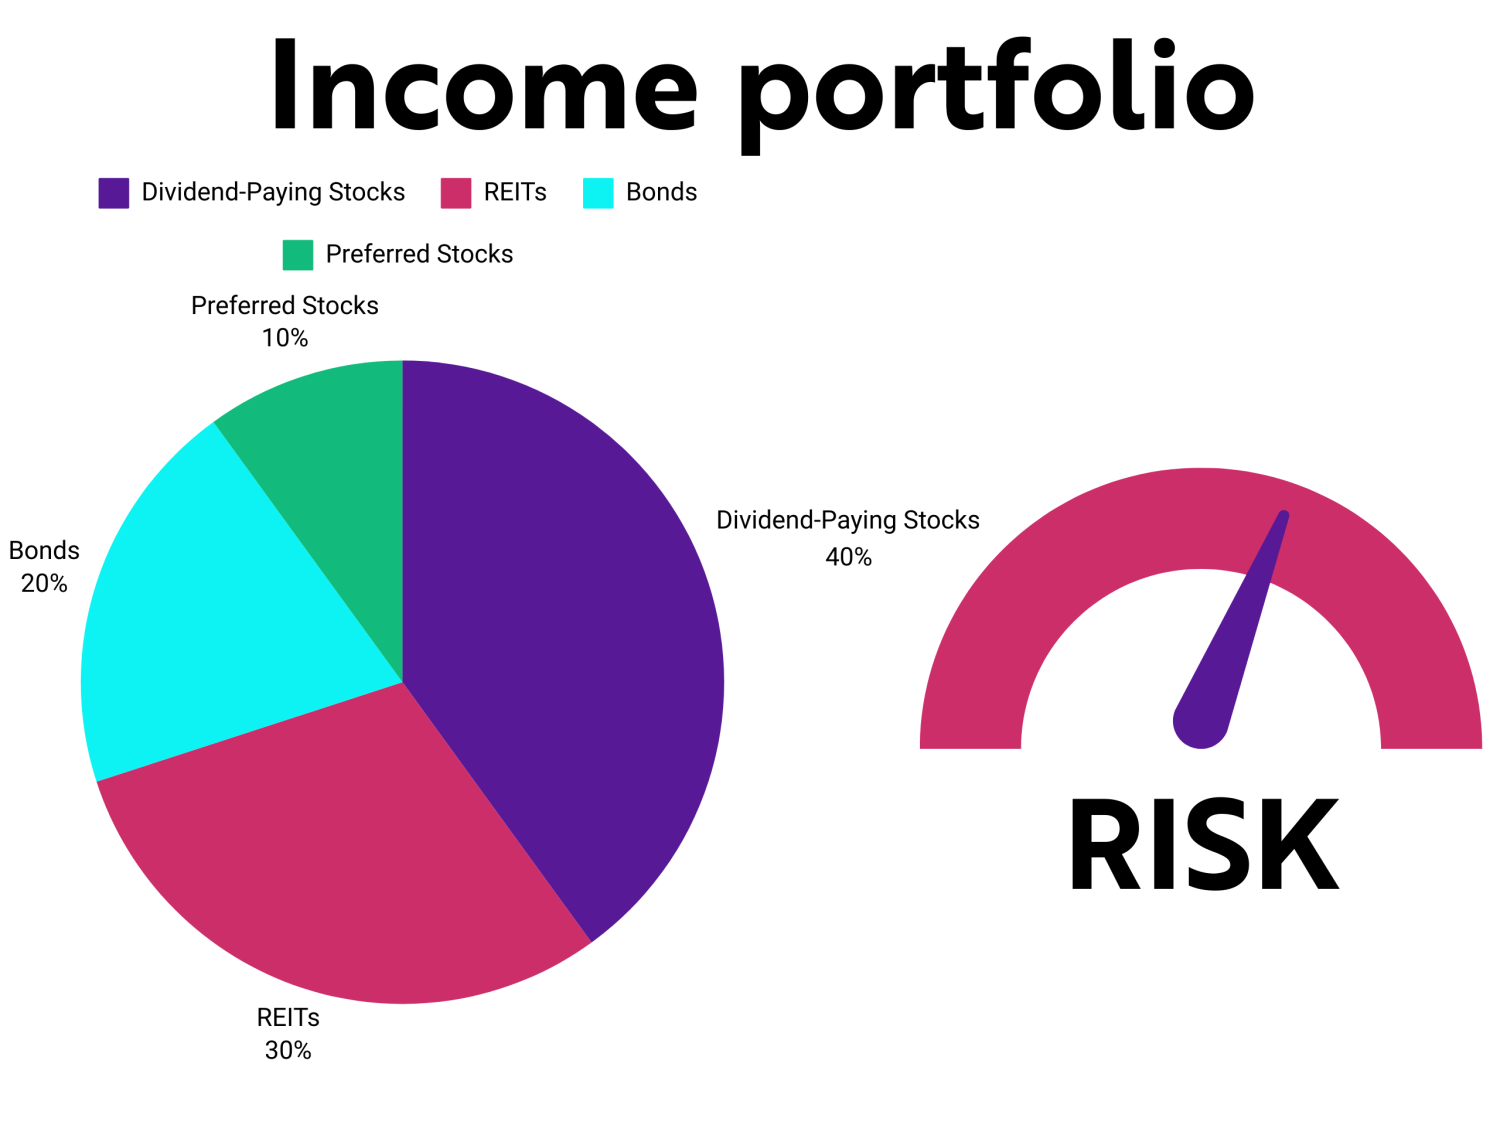
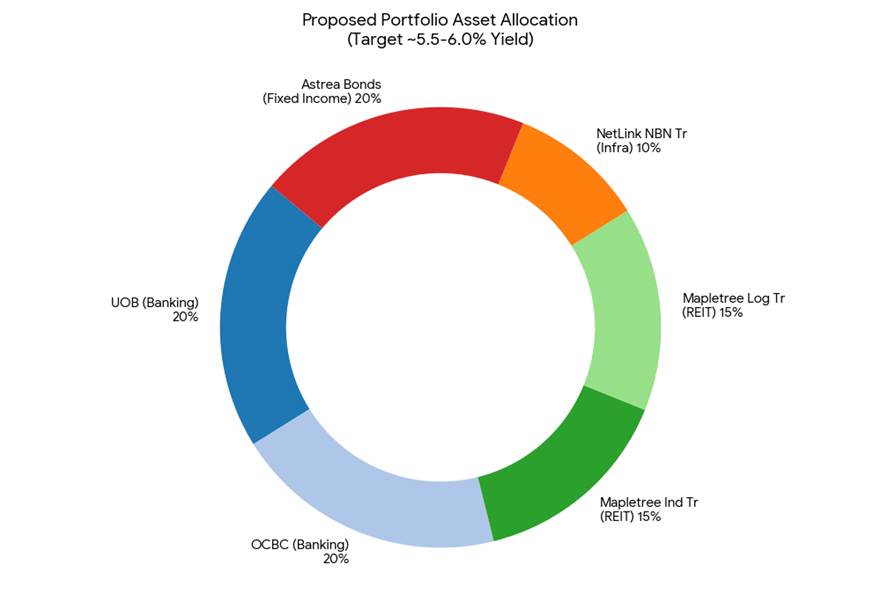
- Bonds (4–6% yield) Public lending for stability; perform well in recessions/rate cuts.
- Private Credit (8–10%+ yield) Direct lending to mid-sized companies (e.g., via BDCs like Blackstone Secured Lending/BXSL ~11% in late 2025). Higher yields from perceived (but managed) risk—secured loans lower defaults than some bonds.
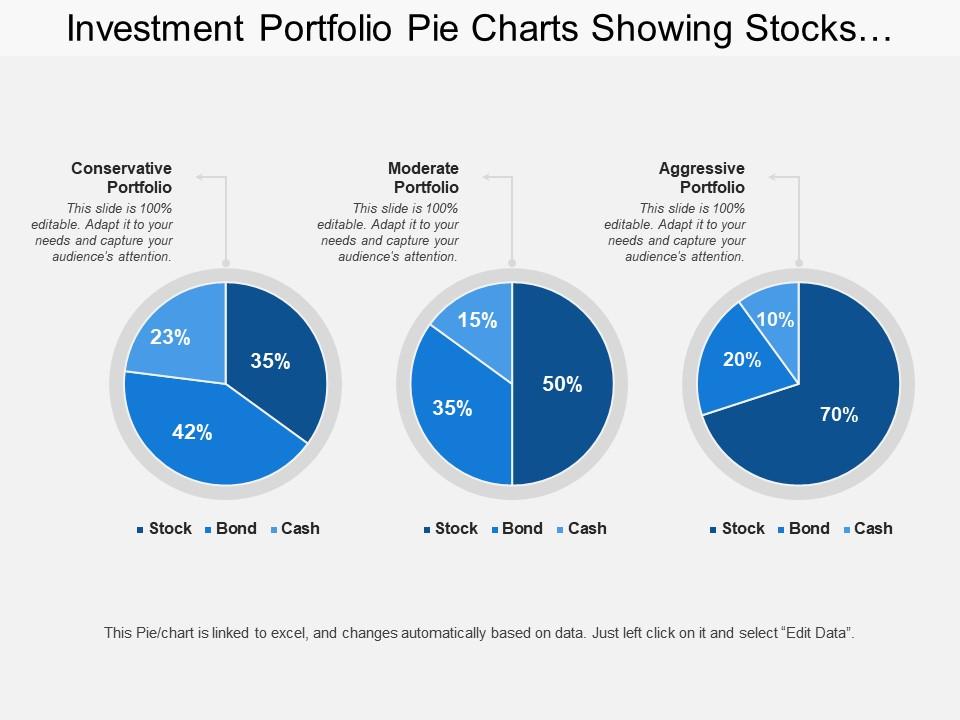
Why Diversify?
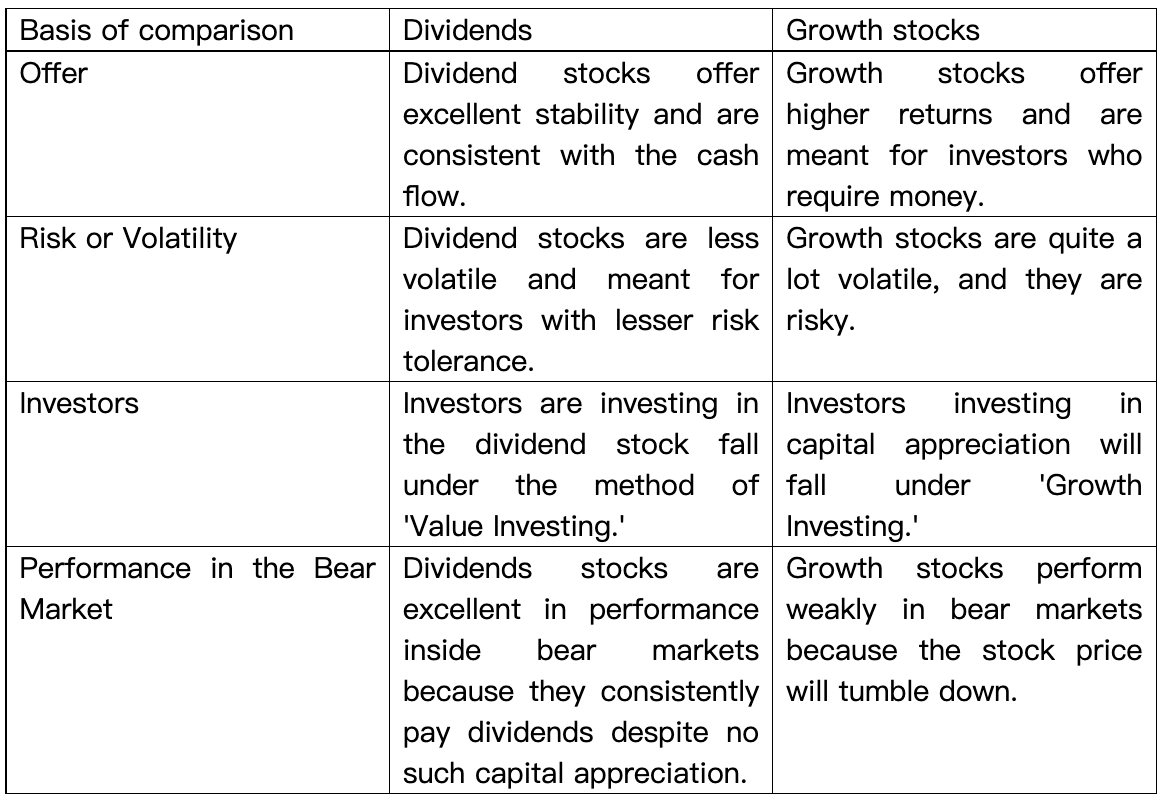
No single asset thrives in every environment:
- Rising rates (2022): REITs suffered; private credit/banks excelled.
- Falling rates (2025): REITs rebound; bonds stabilize.
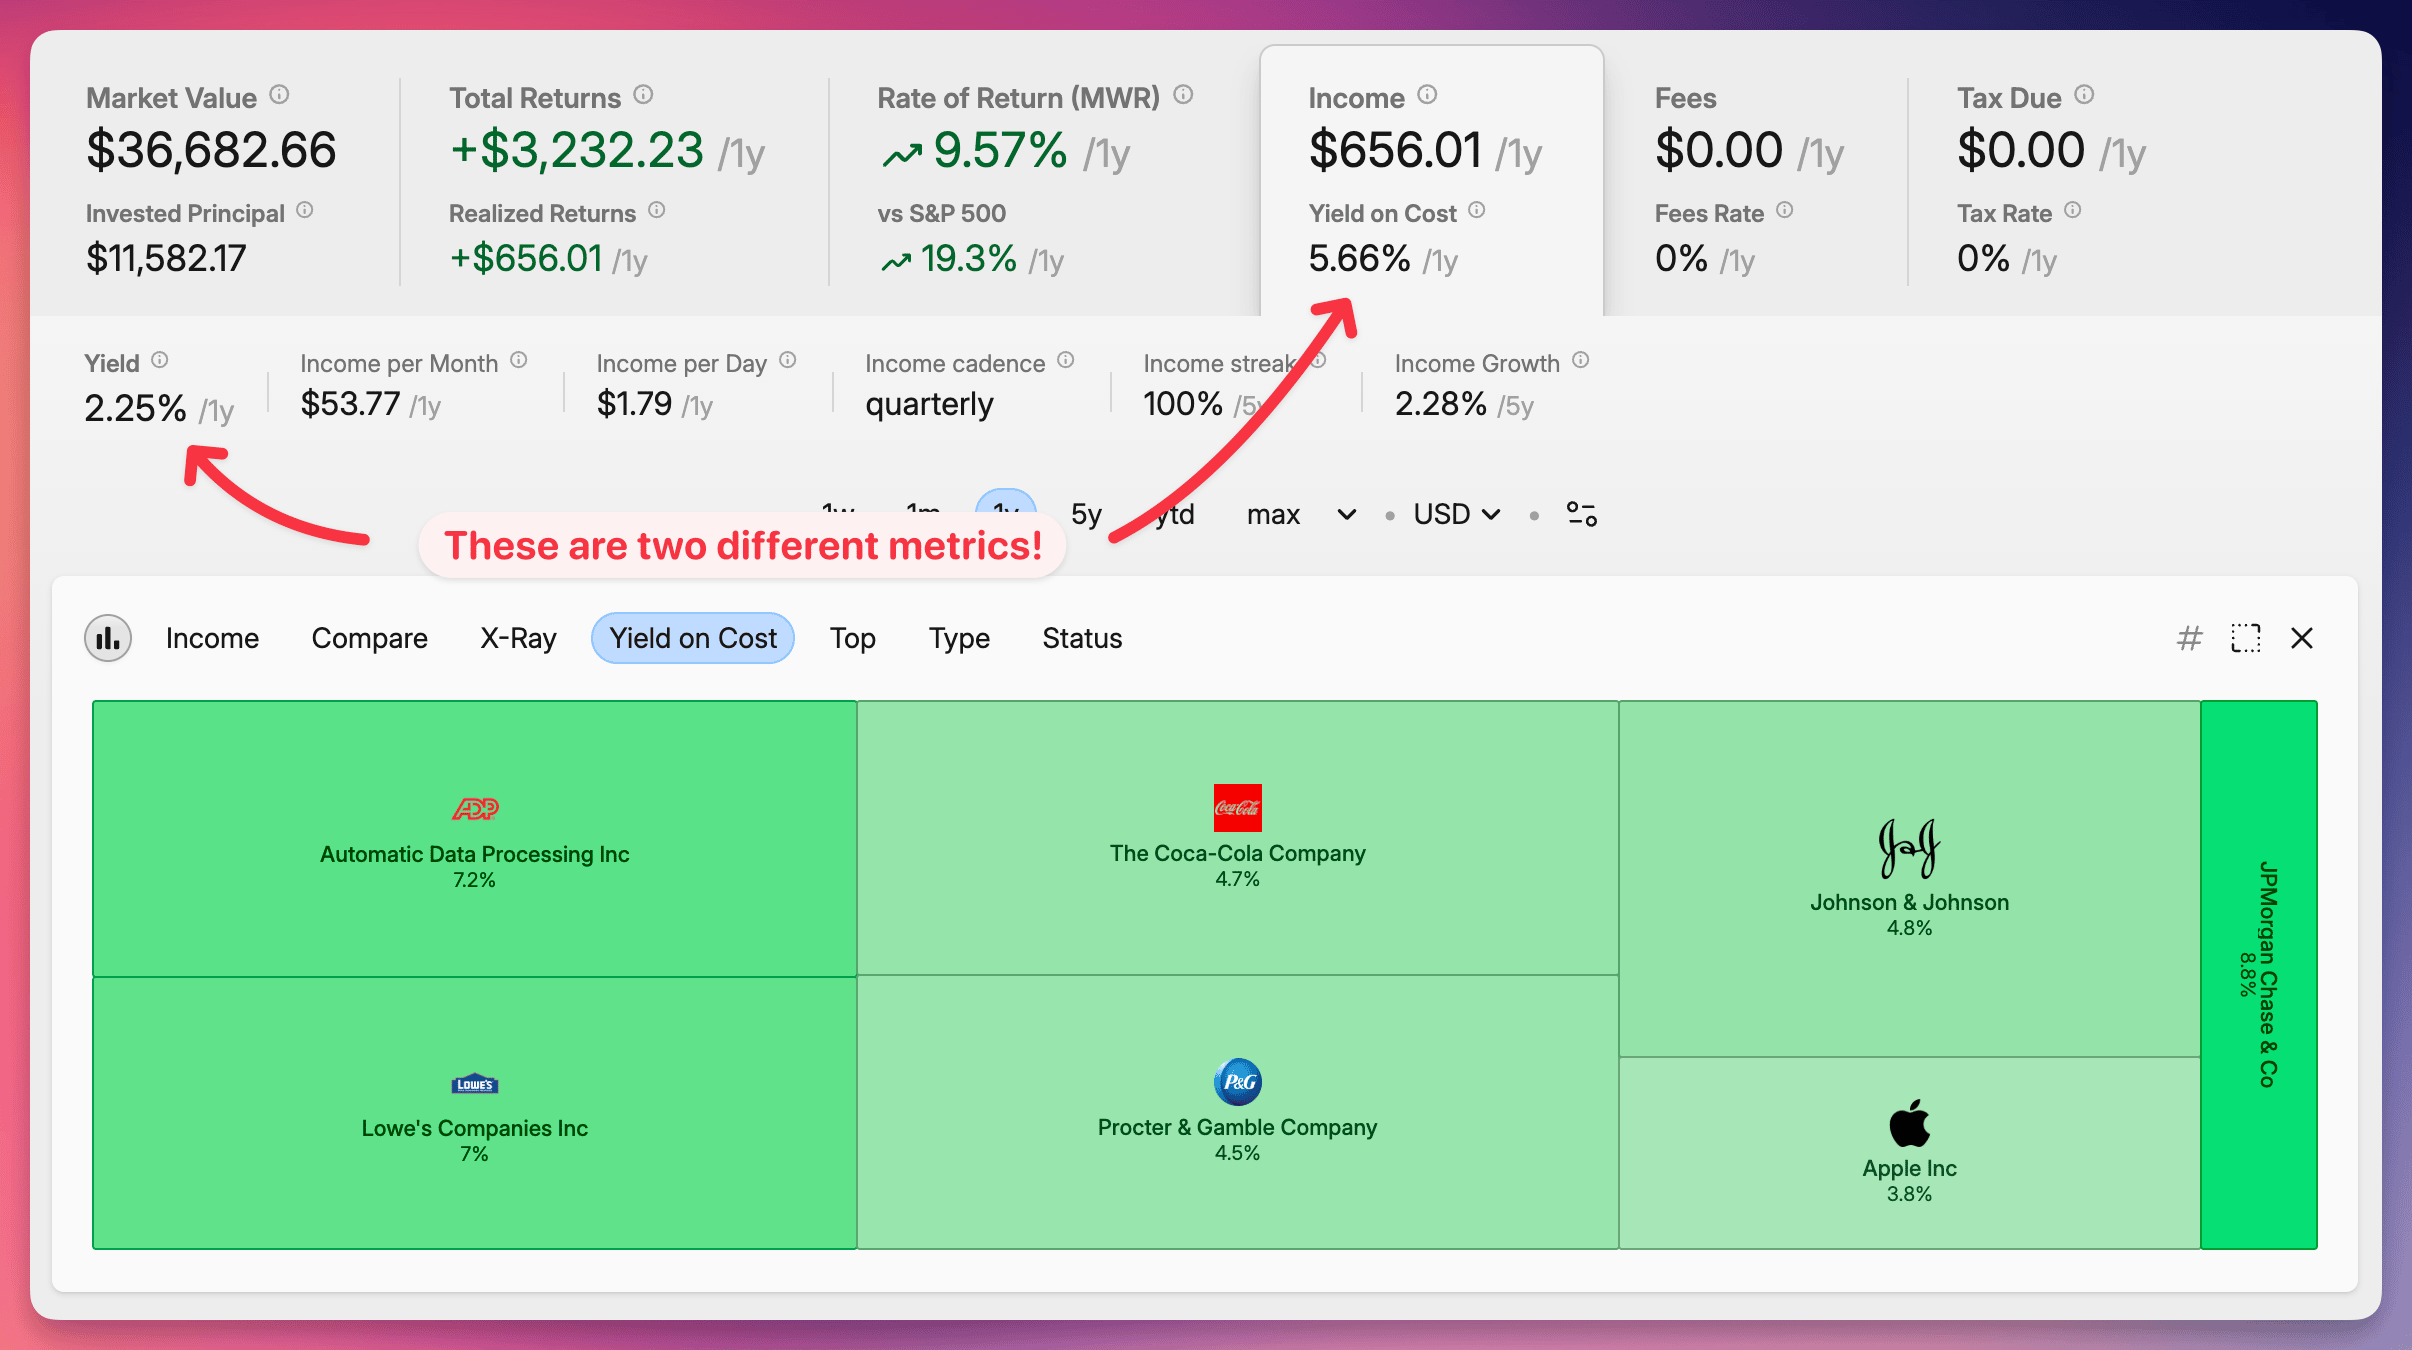
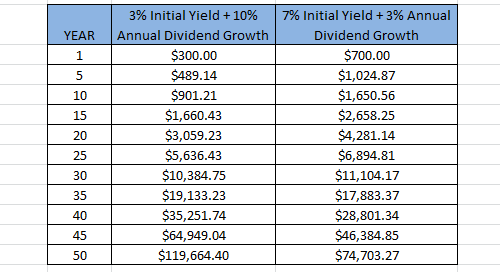
Growing dividends (stocks/REITs/private credit) compound yields over time (e.g., initial 5.5% → 10–17% on cost after 5–10 years).
Realistic Assessment (Late 2025 Context)
- 6% portfolio yield is ambitious but achievable with international/high-yield focus (Singapore banks/REITs ~5–6%; BDCs ~9–11%). Pure US quality dividends often 2–4%; balanced portfolios typically 4–5.5%.
- 10% total return aligns with long-term S&P 500 (~10% including dividends).
- Private credit vs. bonds: Higher yields valid, but added illiquidity/risk.
- Low entry: Many assets start small (e.g., ~$30–200 minimums).
Getting Started
Educate on quality selection (consistent growth, strong balance sheets). Buy undervalued (below intrinsic value). Start small; compound early. The speaker promotes an "Income Investor" course for detailed criteria.
This strategy leverages compounding and diversification for sustainable passive income. Risks include market downturns, dividend cuts, and interest rate shifts—focus on quality/resilience. Realistic yields may be 4–6%; adjust goals accordingly. Start saving/investing consistently for long-term freedom.
Hidden Tax Incentives: How the Government "Pays" for Certain Investments (Approximately 2,500 words – 10-minute read)
This promotional video argues that the U.S. tax code is largely a roadmap of incentives—98% of it designed to encourage behaviors the government wants, like building housing, producing energy, growing food, and creating jobs. Rather than viewing taxes as punishment, savvy investors and business owners use these rules to reduce liabilities and amplify returns. The speaker highlights real estate, energy (oil/gas/renewables), Bitcoin mining, agriculture, conservation easements, business ownership, and Opportunity Zones as prime examples where deductions/deferrals effectively let the government subsidize investments.
:max_bytes(150000):strip_icc()/GettyImages-482855989-93236a8122dd4e94bd3a8ba43c5ac9a5.jpg)

Core Philosophy
The government prefers private sector action over direct spending, offering tax breaks as "win-win" incentives. Compliance is required, but strategic alignment yields massive savings—often leveraging debt and accelerated deductions.
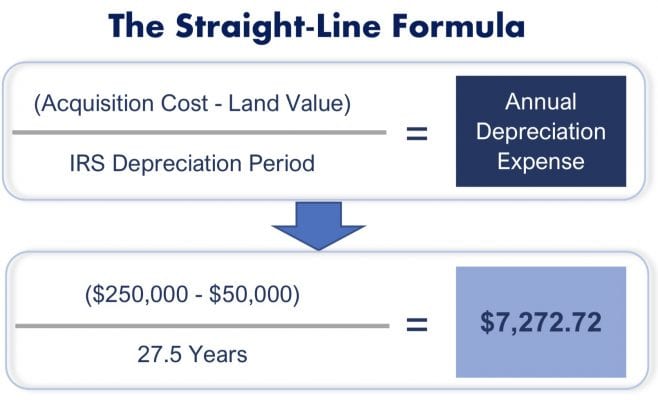
Real Estate: Leveraged Depreciation
Real estate enjoys favored status due to housing/economic needs. Key benefit: depreciation (wear/tear deduction) even as values rise.
- Bonus Depreciation & Cost Segregation: Short-lived components (appliances, cabinets ~20% of cost) qualify for accelerated write-offs. In 2025, the "One Big Beautiful Bill Act" (OBBBA) restored permanent 100% bonus depreciation for qualifying property placed in service after January 19, 2025 (earlier: 40%). A $1M property might yield $200–300K first-year deduction via segregation.
- Debt Leverage: Borrow 80%; you get 100% of depreciation (bank gets none). Turns modest equity into large tax shields.
Commercial properties (e.g., convenience stores, car washes) often get higher benefits than residential.

Energy Investments: High-Risk, High-Reward Deductions
Energy security drives incentives.
- Oil & Gas: Intangible Drilling Costs (IDCs) ~60–85% of well expenses (labor, fluids) are 100% deductible in year incurred (longstanding rule). Tangibles depreciated; percentage depletion allows ~15% tax-free on production.
- Renewables: Credits/deductions for solar/wind, though varying by administration.
Invest late-year; deduct even if drilling starts next.


Bitcoin Mining: New 2025 Equipment Write-Offs
OBBBA's 100% bonus applies to mining hardware (5–7 year life). Deduct full cost year placed in service, offsetting ordinary income. Promoted by firms like Blockware as tax shield + BTC accumulation (not tax advice).
Agriculture & Conservation: Food Security Incentives
Farming offers expansive deductions: 100% for livestock/feed/buildings. Many pay little/no tax.
- Conservation Easements: Perpetual donation of development rights yields charitable deduction (FMV difference pre/post-easement). IRS scrutinizes abuses; must be qualified/perpetual.
Business Ownership: Ultimate Control
Every country incentivizes businesses for jobs/growth. Deduct expenses before tax (vs. employees' gross). Home office, startup costs (~$5K immediate), reinvestments untaxed until sale.
Opportunity Zones: Capital Gains Deferral
Invest gains in distressed areas via Qualified Opportunity Funds: Defer tax; 5–7 year step-up; 10+ years no tax on new appreciation. 2025 updates enhanced rural incentives.

Leverage Formula & Risks
Speaker's math: Standard 7% return doubles money in ~10 years; add debt (quadruples); tax benefits (octuples). Real returns vary; risks include audits, recapture, market shifts.
These incentives are real/code-based, but require proper structuring (cost segregation, qualified investments). Overstatements (e.g., pre-2025 bonus rates) common in promotions. Consult professionals; IRS scrutinizes aggressive claims. Used correctly, they legally reduce taxes while aligning with policy goals.
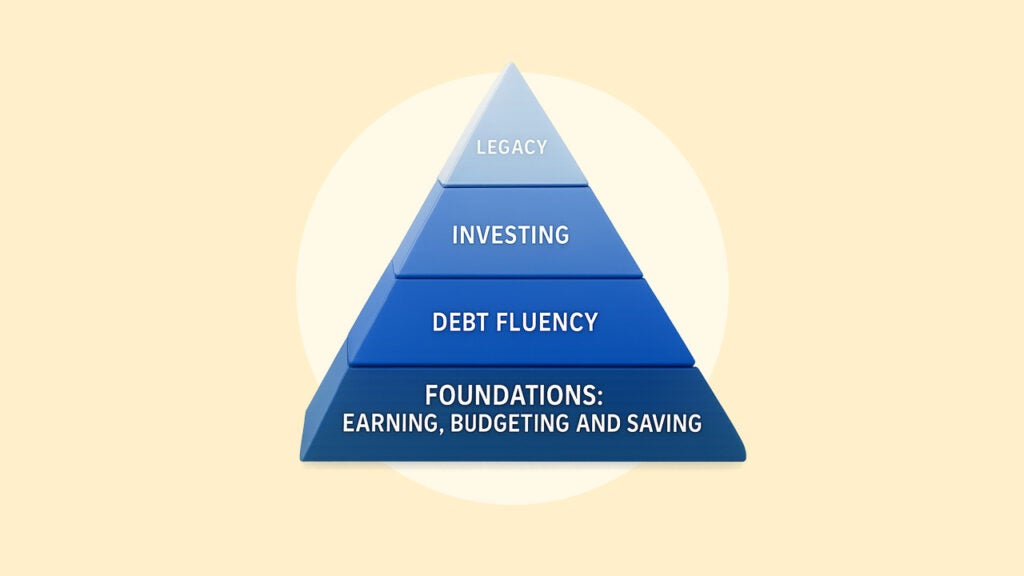
Six Quiet Signs You're on Track to Become a Millionaire (Approximately 2,400 words – 10-minute read)
This motivational video draws from studies like Ramsey Solutions' National Study of Millionaires (10,000+ participants) and classics like The Millionaire Next Door. It debunks myths: 79–80% of U.S. millionaires received no inheritance, and ~8 in 10 grew up in middle- or lower-income families. Top careers include engineer, accountant, teacher, manager, and attorney—not flashy high-earners like doctors or athletes. Wealth stems from consistent habits, not luck or salary alone. The speaker (who reached $1M in his 30s) outlines six pre-wealth behaviors. Exhibiting even 2–3 signals strong potential.


Sign #1: Track Your Numbers Relentlessly
Future millionaires build awareness first. Without tracking, money leaks unnoticed (subscriptions, dining). The speaker started 8 years pre-millionaire status, auditing monthly expenses vs. income (earned + passive) and net worth bi-monthly.
Benefits: Empowerment, control, clarity—spot cuts (roommates, cooking, cancellations). If you know your exact net worth and monthly flow, you're ahead.
Sign #2: Prioritize Ownership Over Earning
High income ≠ wealth; many big earners spend it all. Millionaires start with steady jobs, live below means, and invest surpluses in assets. Assets (not salary) compound wealth via leverage and passive income.
Top Assets: Stocks, real estate, profitable businesses, intellectual property/royalties. Stack multiple for diversification.

Sign #3: Build Systems, Not Just Goals
Motivation fades; systems endure. Goals rely on willpower; systems automate success (thermostat analogy: adjusts automatically vs. wishing for warmth).

Key Systems:
- Automations → 401(k)/IRA contributions, dividend reinvestment.
- Rules → Never underpaid (negotiate); fixed guidelines.
- Routines → Monthly expense audits, bi-monthly net worth checks.
Even partial adoption builds momentum.
Sign #4: Never Treat Wealth as Permanent
Wealth requires ongoing maintenance—like a high-performance car. Crises (crashes, health issues, divorce) test it. Complacency risks: over-leverage, lifestyle inflation, neglecting basics (budgeting, skill-building).
Operate wealth like a business/machine: monitor, adjust, protect.
Sign #5: Think in Percentages, Not Dollars
Percentages remove emotion, respect compounding, and scale consistently.
Advantages:
- Focus on steady gains (10–15%/year) over "big wins."
- Visible progress at any level (10% growth feels same on $50K or $5M).
- Disciplined scaling (e.g., invest fixed % of rising income).
Sign #6: Maintain a High Savings Rate
Savings rate predicts wealth more than income. Raises fuel savings first (upgrades later/never). Builds buffers for risks/opportunities.
Perks: Financial resilience, freedom (career shifts, downturns).
These habits—backed by studies—turn modest starts into millions through consistency. If you're practicing a few, millionaire status is likely a matter of time.
$9,000 in Dividends: Growth-Focused Portfolio Insights (Approximately 2,400 words – 10-minute read)
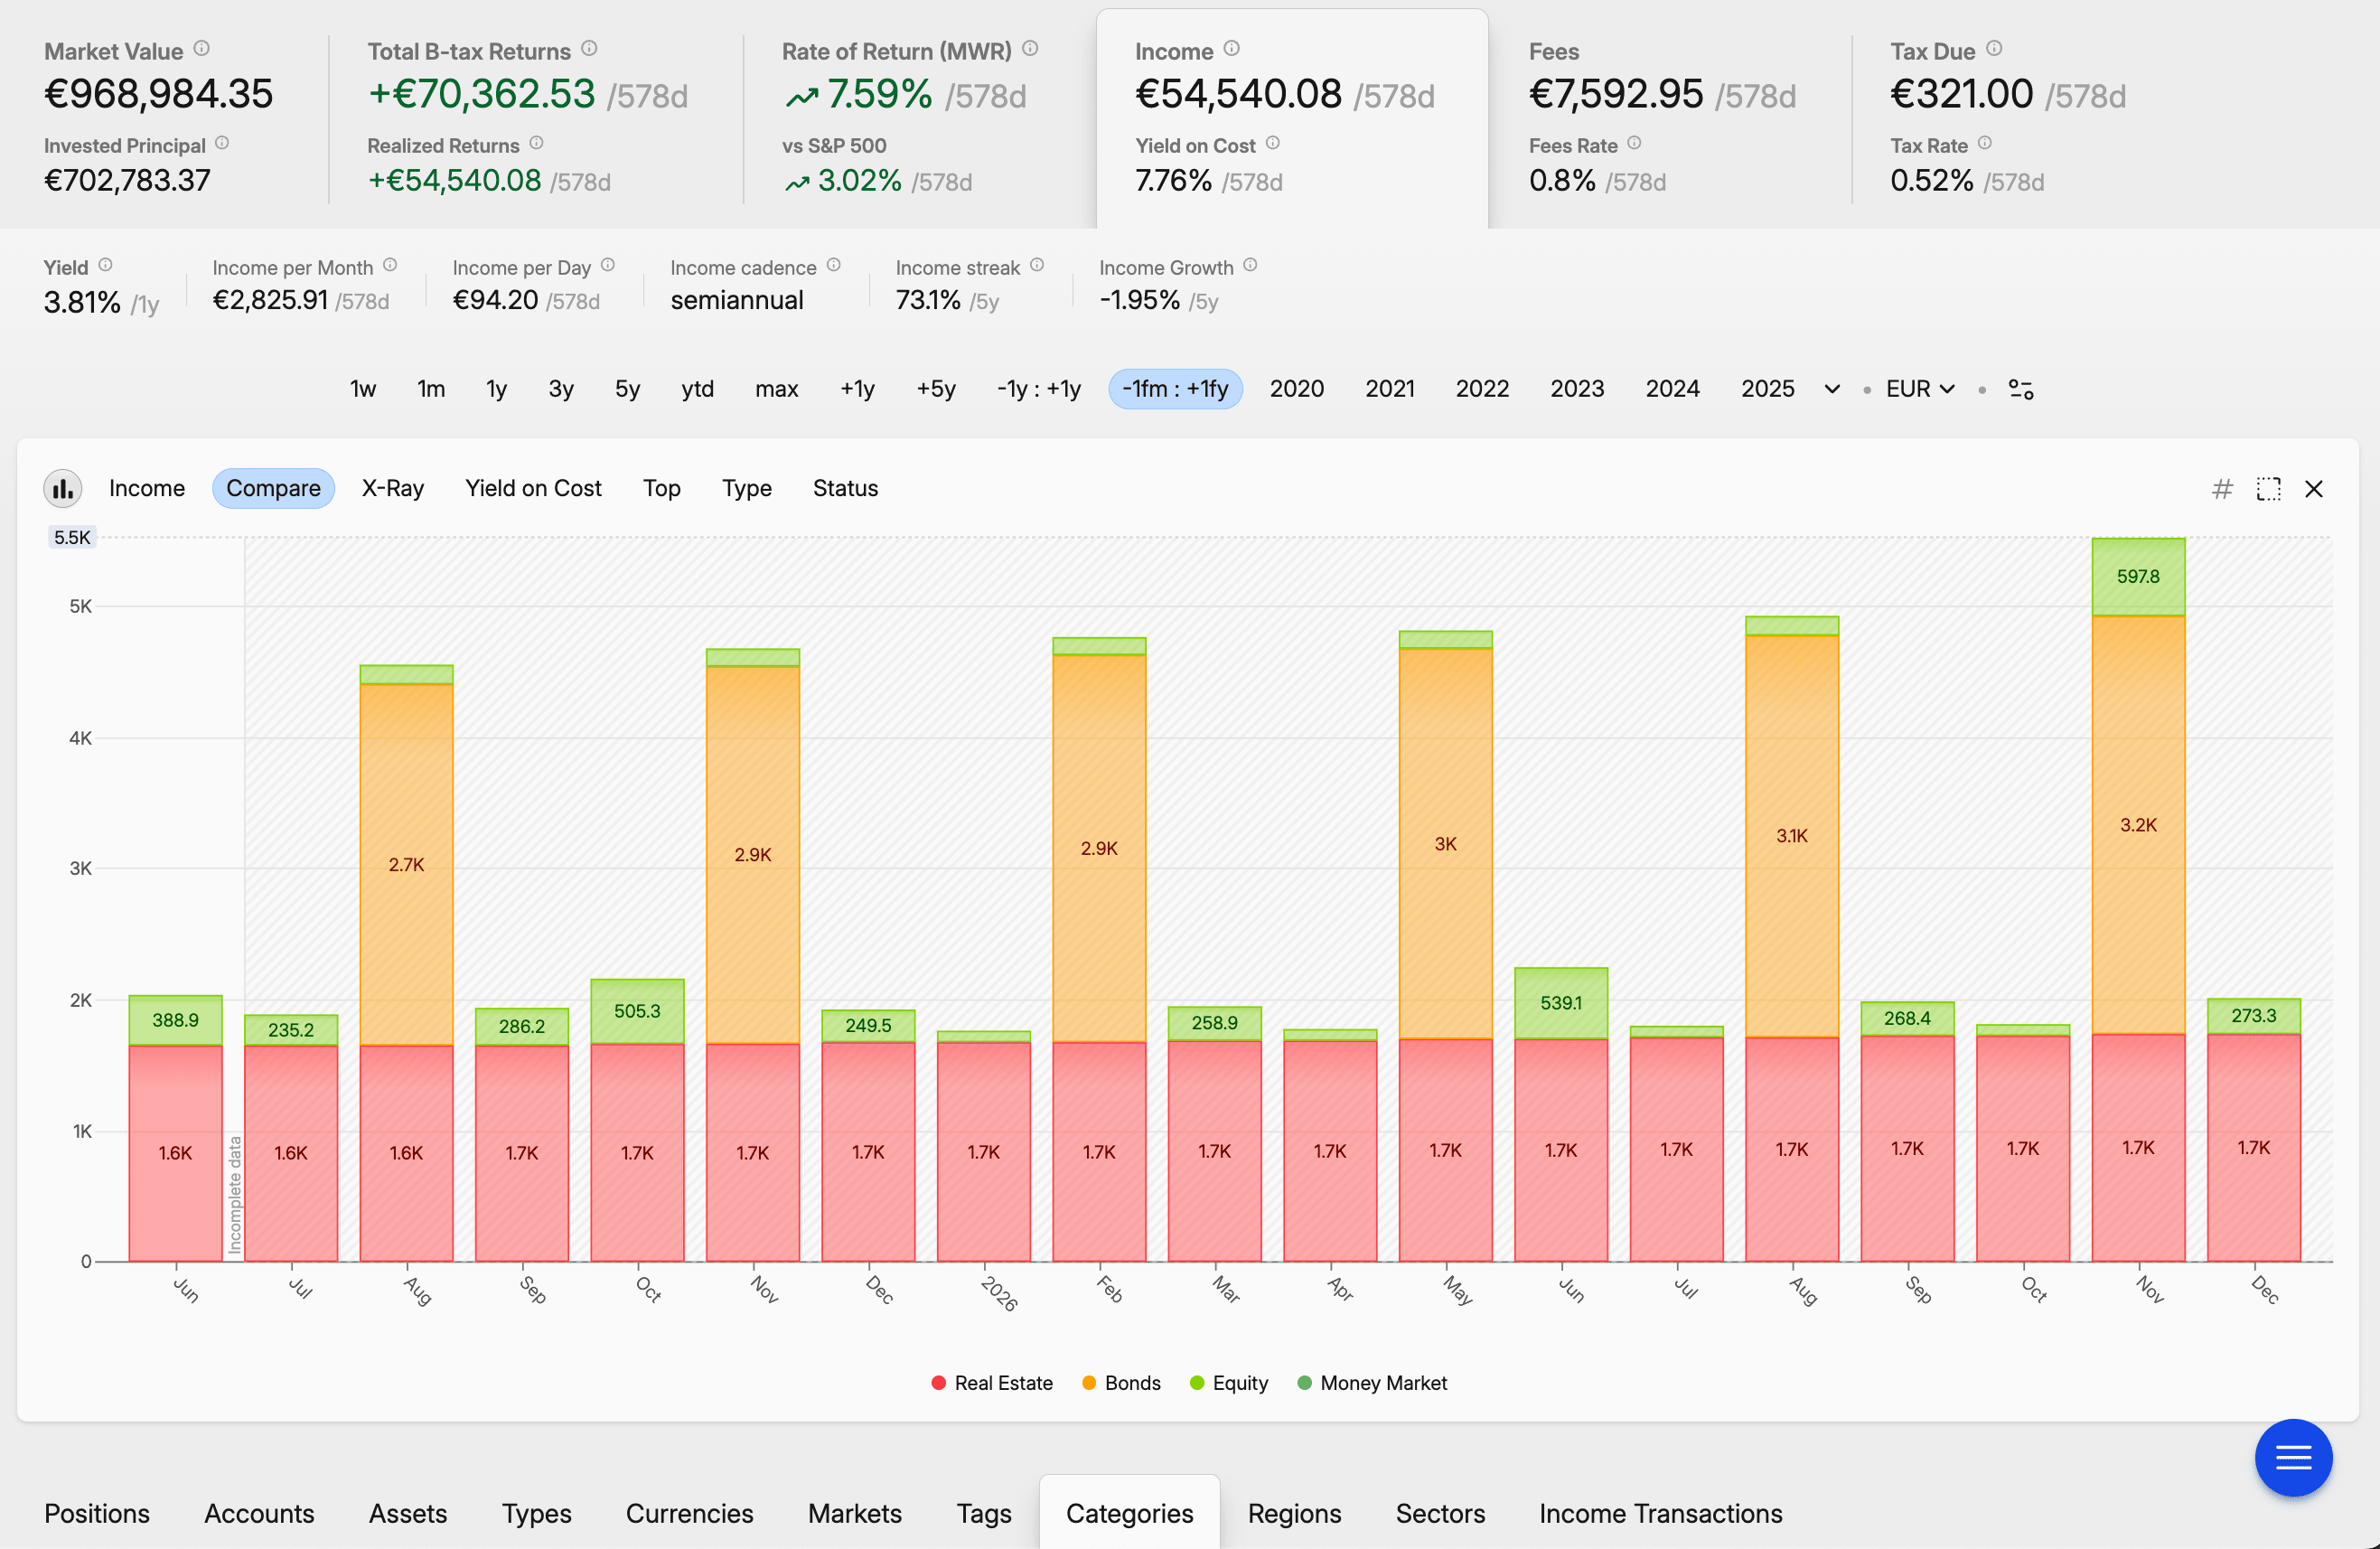
This video shares a personal investing journey, emphasizing consistency and the power of small starts. The creator received $9,236 in dividends from a ~$969,000 portfolio (0.91% yield) but argues dividends motivate while growth builds true wealth—especially for younger investors not nearing retirement.
The Power of Small, Consistent Investments
A "$5 a day" challenge (started January 2022) skipped daily coffee to invest instead, yielding a recent $29 dividend. Scaling this consistency grew the main portfolio to produce thousands annually. Key: Start small; compound over time.
Sponsor: Moomoo brokerage (up to $1,000 Nvidia stock + 8.1% APY on cash, ending Dec 31, 2025).
Portfolio Breakdown (~$969K Value)
Mix prioritizes growth with dividend elements:
- Broad indexes → Total U.S. market (VTI), S&P 500 (VOO).
- Growth ETFs → QQQM (Nasdaq-100), SCHG.
- Dividend-focused → SCHD, DIVO.
- Small individual stocks.
Low overall yield (0.91%) reflects growth tilt—high-growth companies (e.g., AMD/Nvidia) reinvest profits, paying minimal/no dividends.


Dividend Tracker Insights
Tool (e.g., Dividend Tracker app) shows ~$9,236 annual income, spiking in December (~$2,140) due to payout schedules. Quarterly drops (e.g., January ~$110) common; reinvestment grows future payouts.
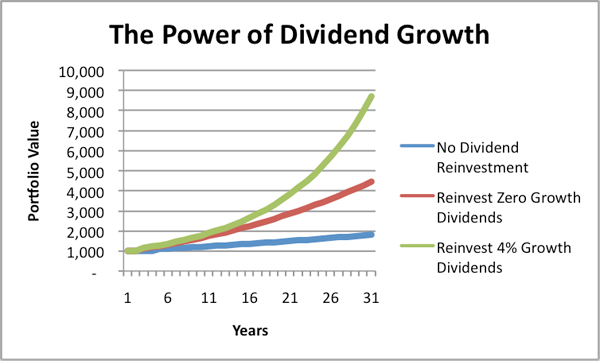
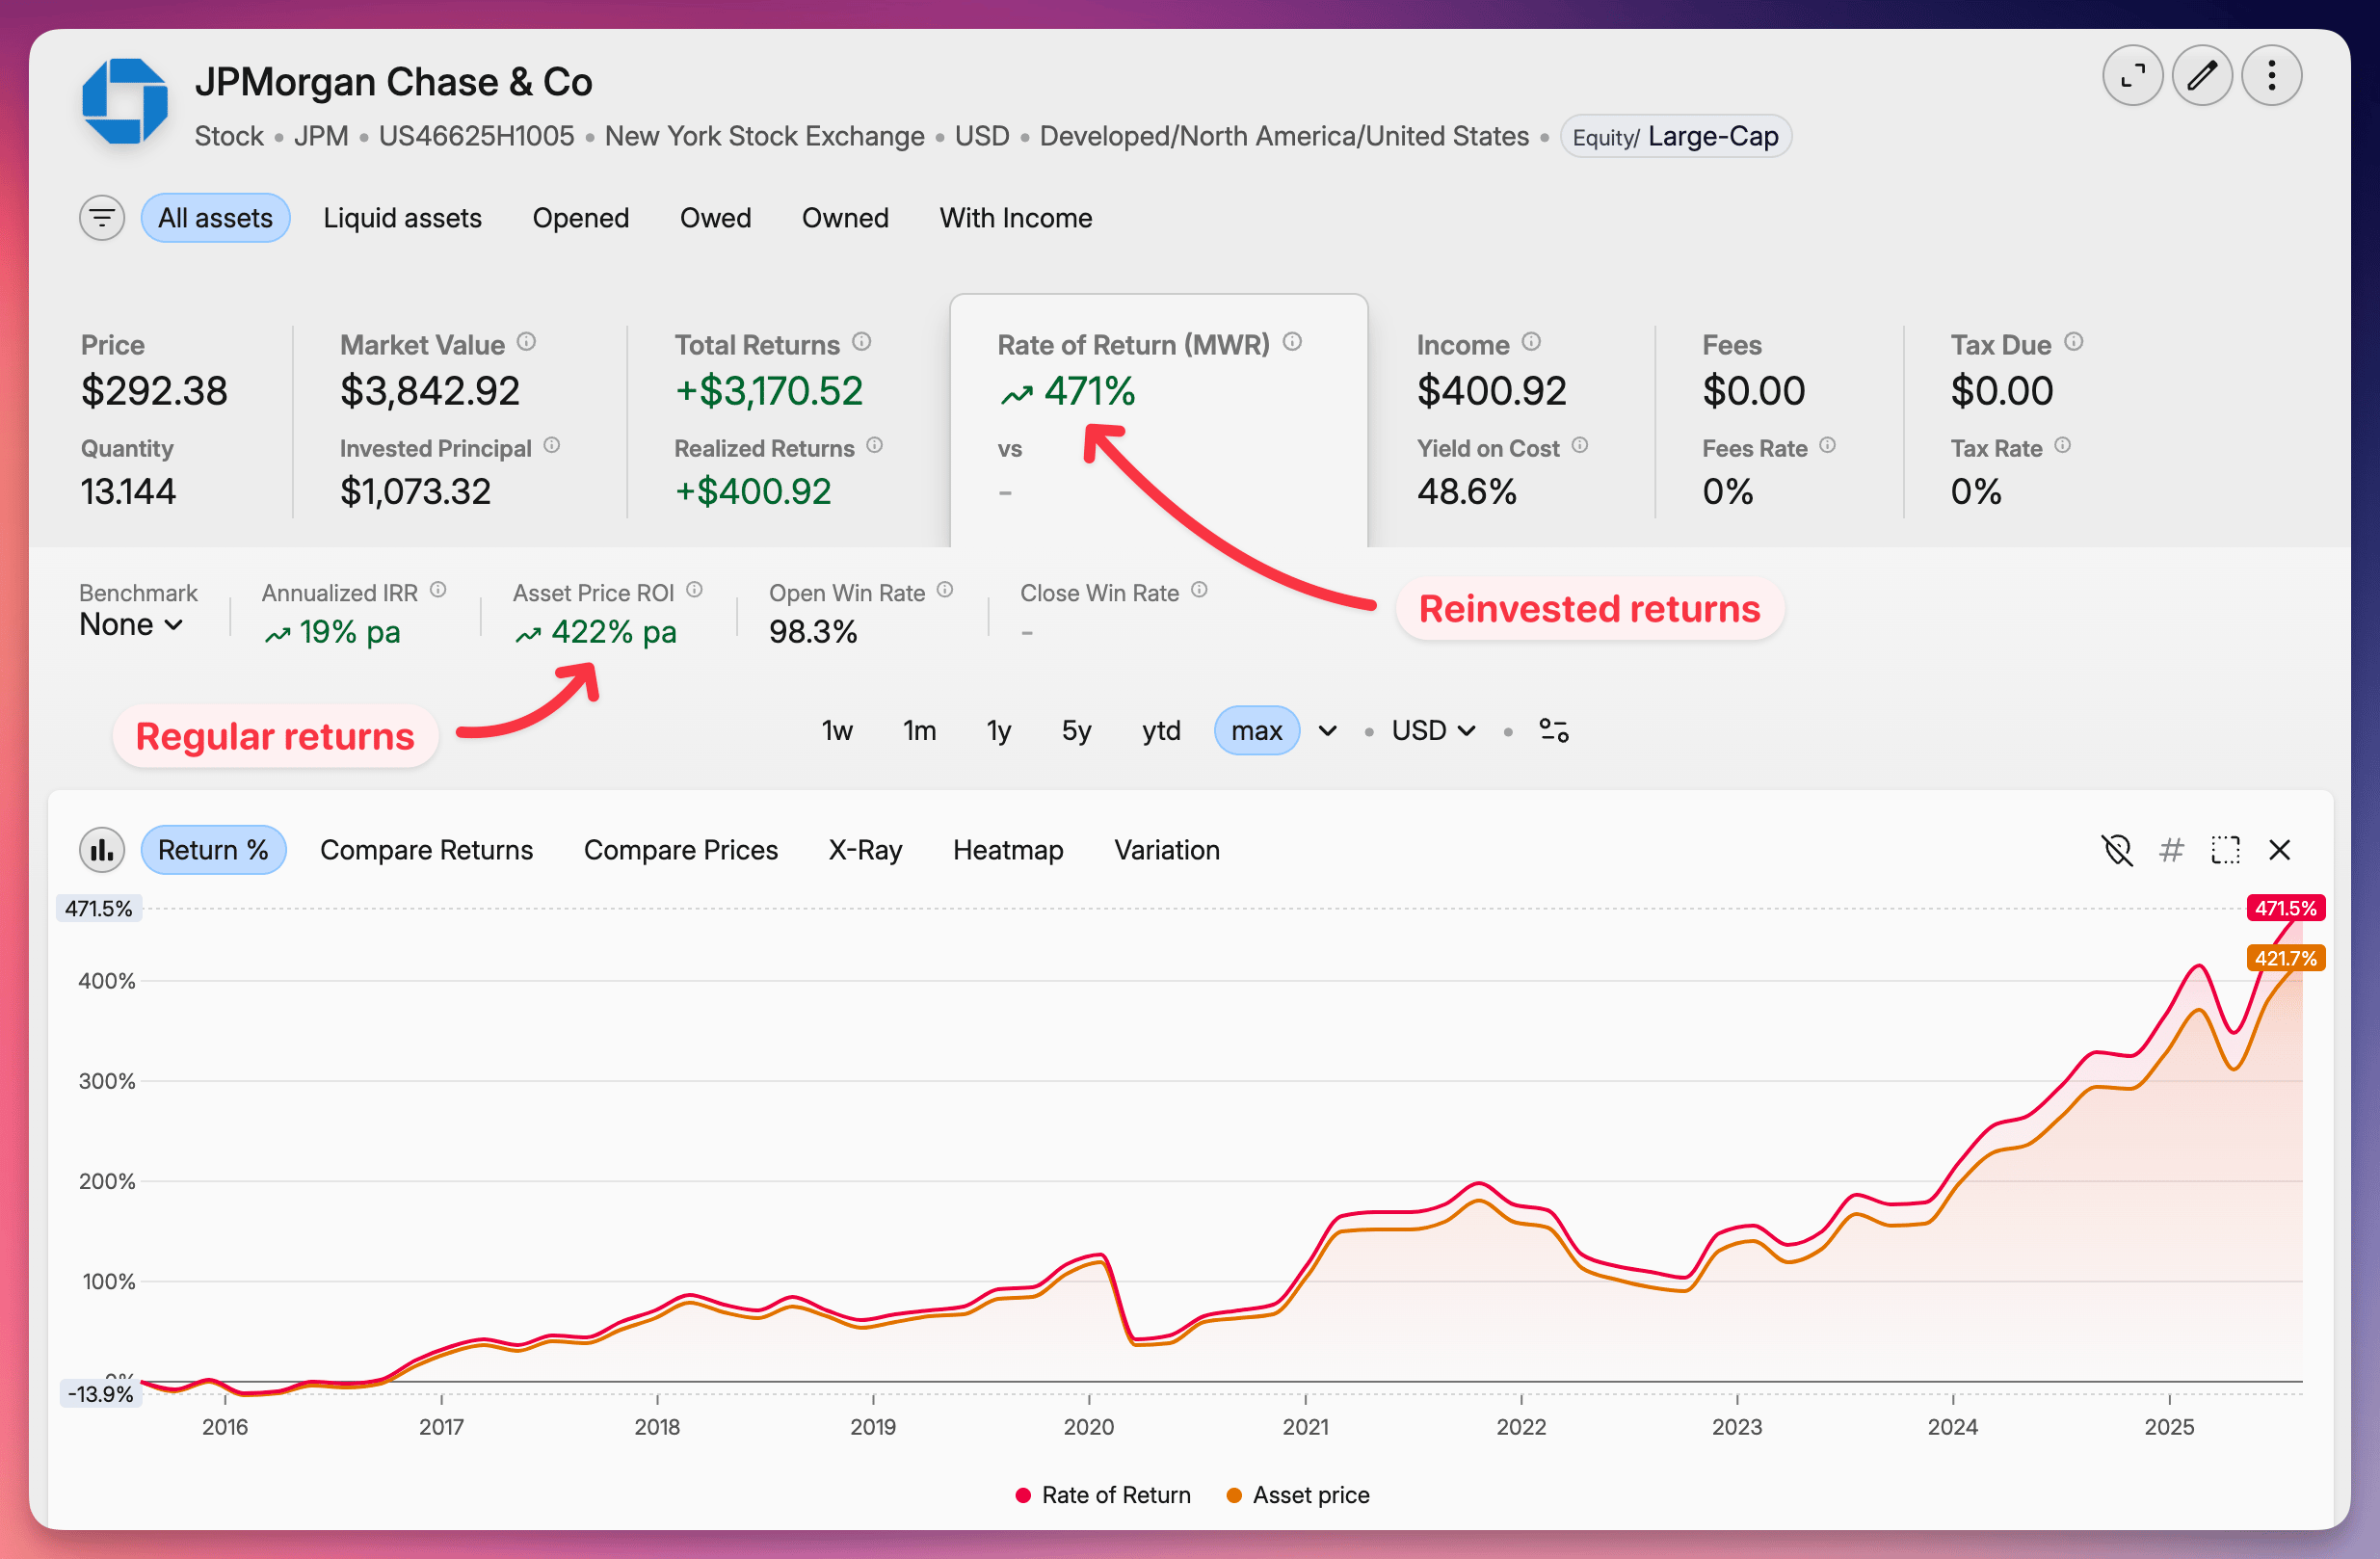
Growth vs. Income: 5-Year Case Study (Seeking Alpha Data)
Price return alone favors broad/growth indexes, but total return (reinvested dividends) tells the fuller story.
Approximate 5-year total returns (as of late 2025):
- QYLD (covered call, high yield) → ~45–48%.
- SCHD (dividend equity) → ~50–55% (lower than video's claim; recent years lagged growth).
- DIVO (enhanced dividend) → ~79–80%.
- VTI (total market) → ~86–89%.
- VOO (S&P 500) → ~100–101%.
- QQQM (Nasdaq growth) → ~106–109%.

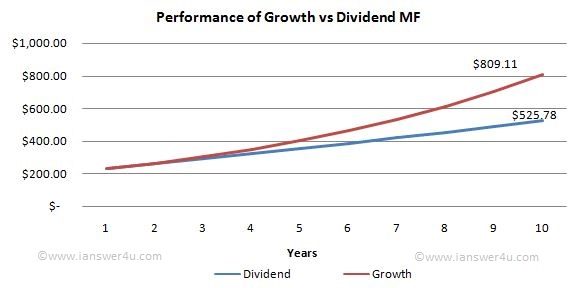
Growth ETFs (QQQM/VOO) outperformed high-yield dividend strategies over 5 years, despite lower/zero dividends—reinvestment in appreciating stocks compounds faster.
Key Takeaway: Align Strategy with Goals/Age
- Income focus (higher yields like SCHD/QYLD) → Suits retirees needing steady cash; less volatile but caps upside.
- Growth focus (QQQM/SCHD blend) → Ideal for younger investors (creator plans retirement in 60s); accepts volatility for higher long-term wealth.
- Dividends motivate consistency; growth drives financial independence.
Volatility note: Growth drops sharply in downturns (e.g., 2022); income provides psychological buffer.
The $9K dividends feel great, but underlying growth (and ongoing contributions) enables future independence. Consistency compounds—small actions scale massively. Creator invites comments for deeper growth vs. dividends dive.
Comments
Post a Comment